[ Table 3 | Table 4 | Table 5 | Table 7 | Table 8 | Table 9 | Table 10 ]
Download all figues [ ps | pdf ].
Table 3: The mean imputation errors (averages of the imputation errors in the 5,000 simulations) as given in Table 3 are shown (click on it to enlarge). Download the plot and the data [ jpg | ps | pdf | csv ].
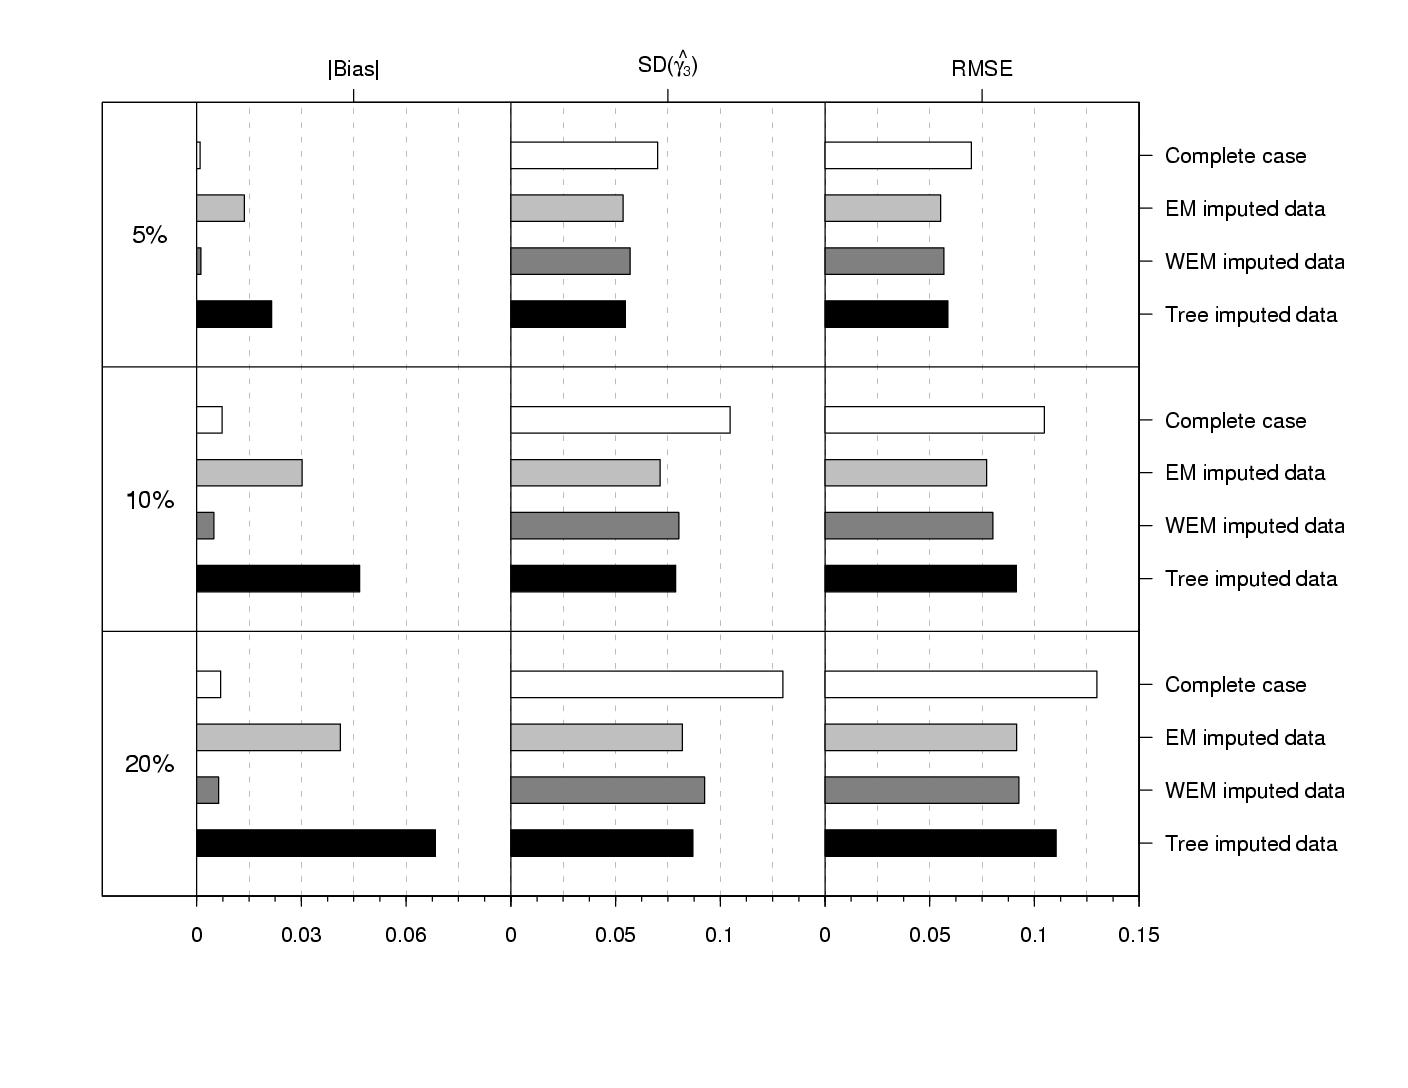
Table 4: The absolute value of the bias, the standard deviation of the parameter estimates, and the root mean squared error as given in Table 4 are shown (click on it to enlarge). Download the plot and the data [ jpg | ps | pdf | csv ].
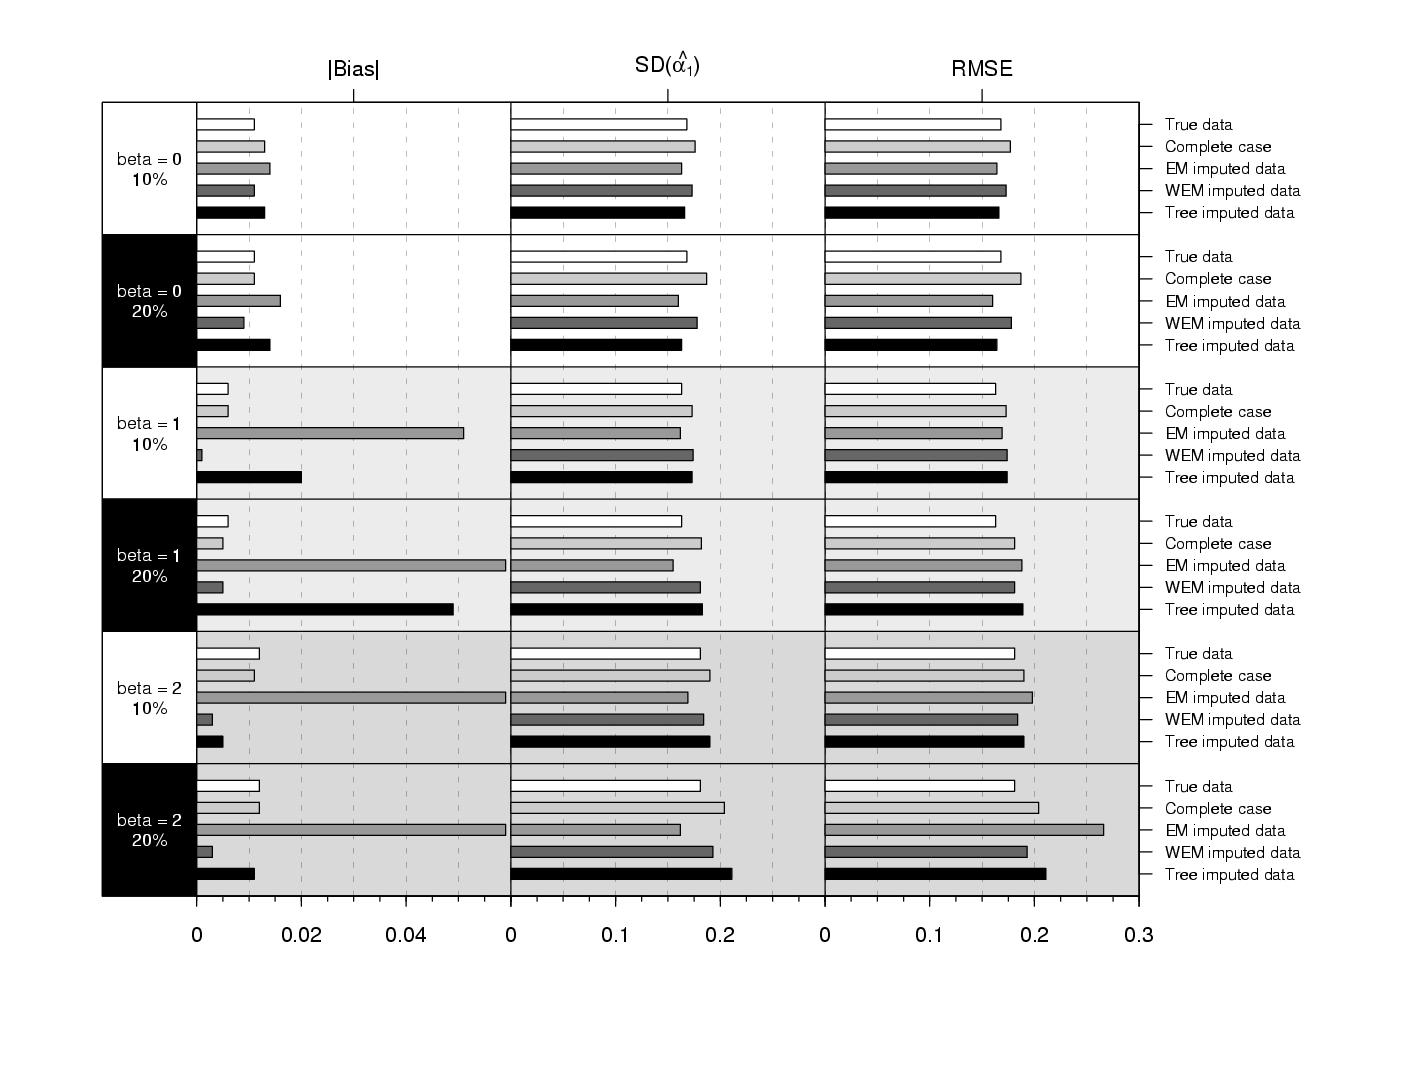
Table 5: The absolute value of the bias, the standard deviation of the parameter estimates, and the root mean squared error as given in Table 5 are shown (click on it to enlarge). Download the plot and the data [ jpg | ps | pdf | csv ].
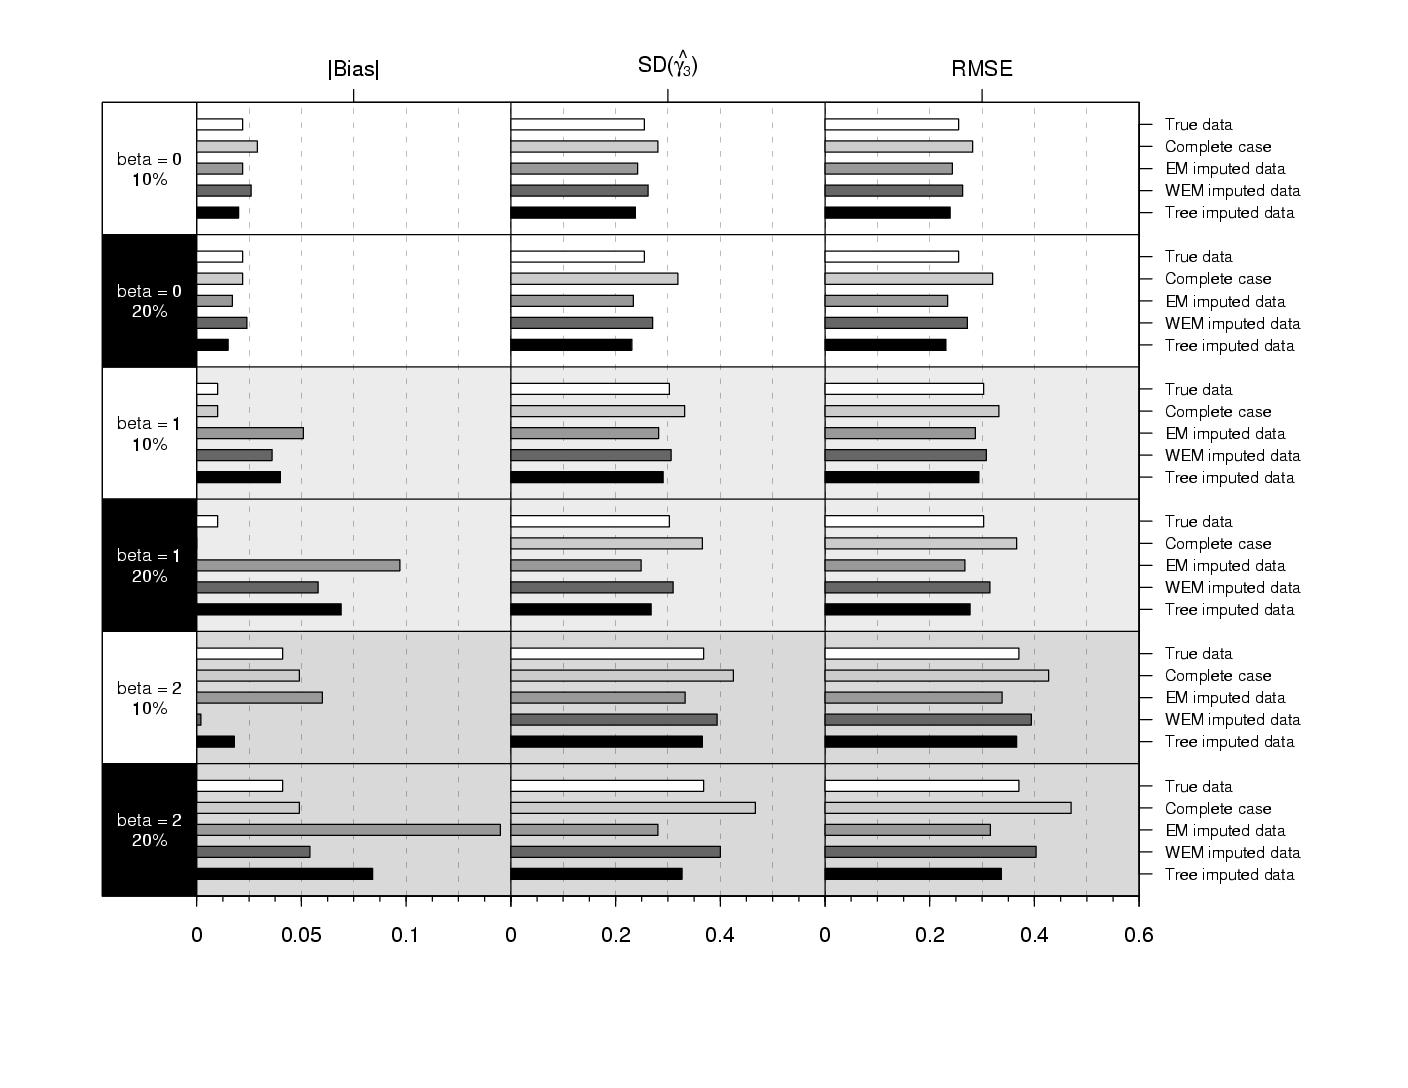
Table 7: The log odds ratio estimates, the standard errors, and the p-values of the different imputation methods for the development dyslexia data, as given in Table 7 are shown (click on it to enlarge). Download the plot and the data [ jpg | ps | pdf | csv ].
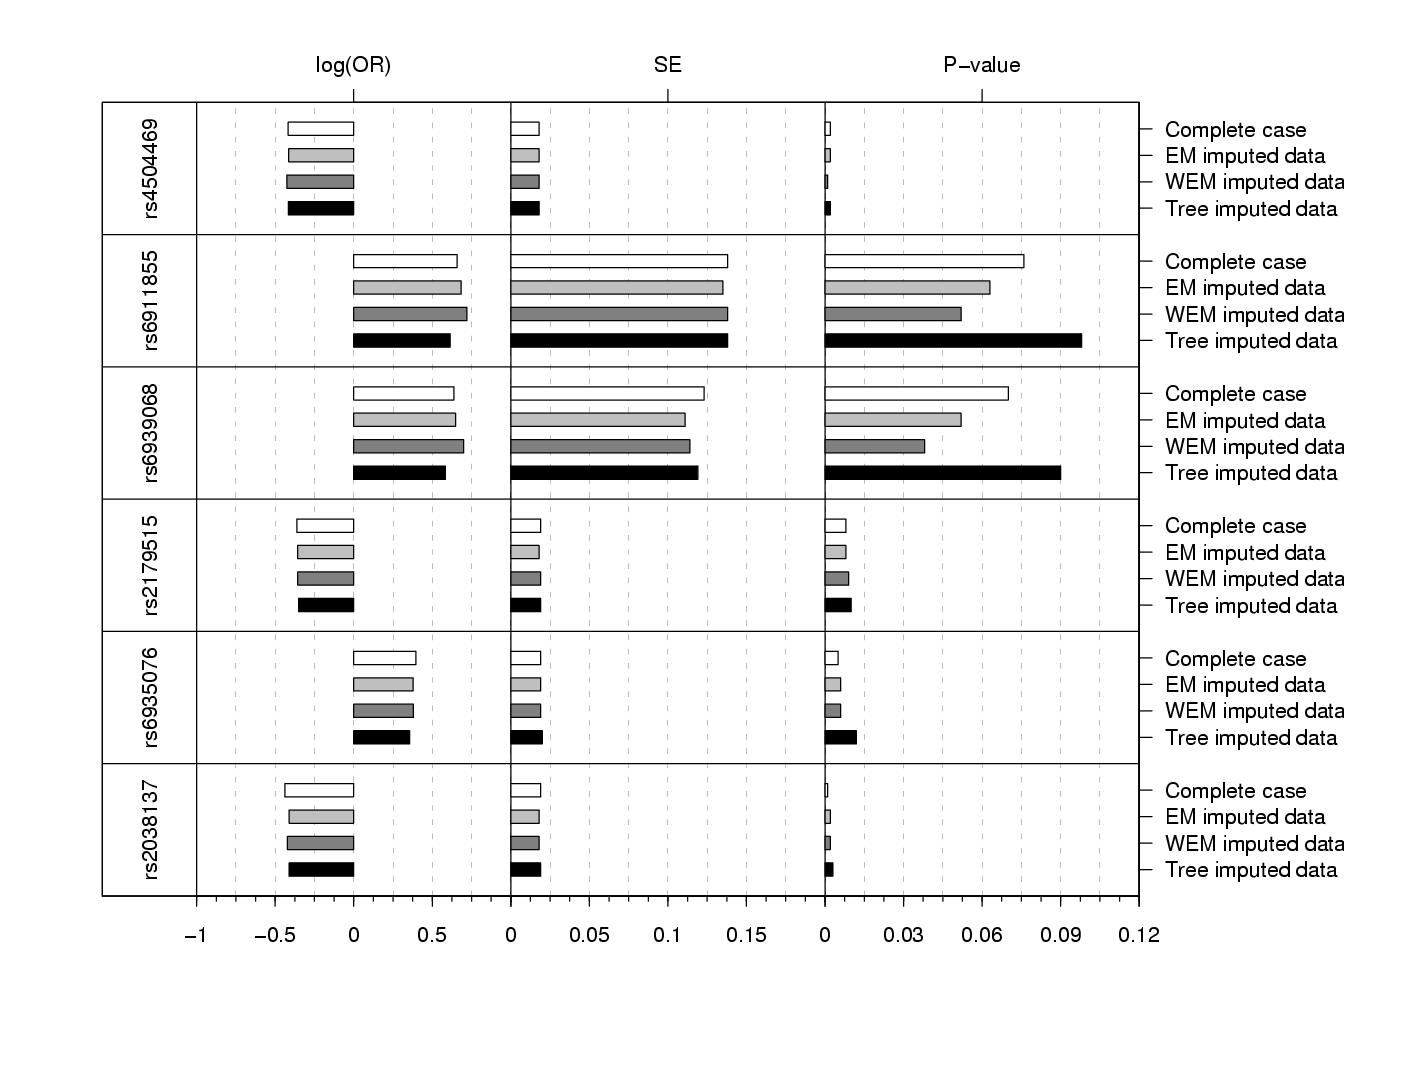
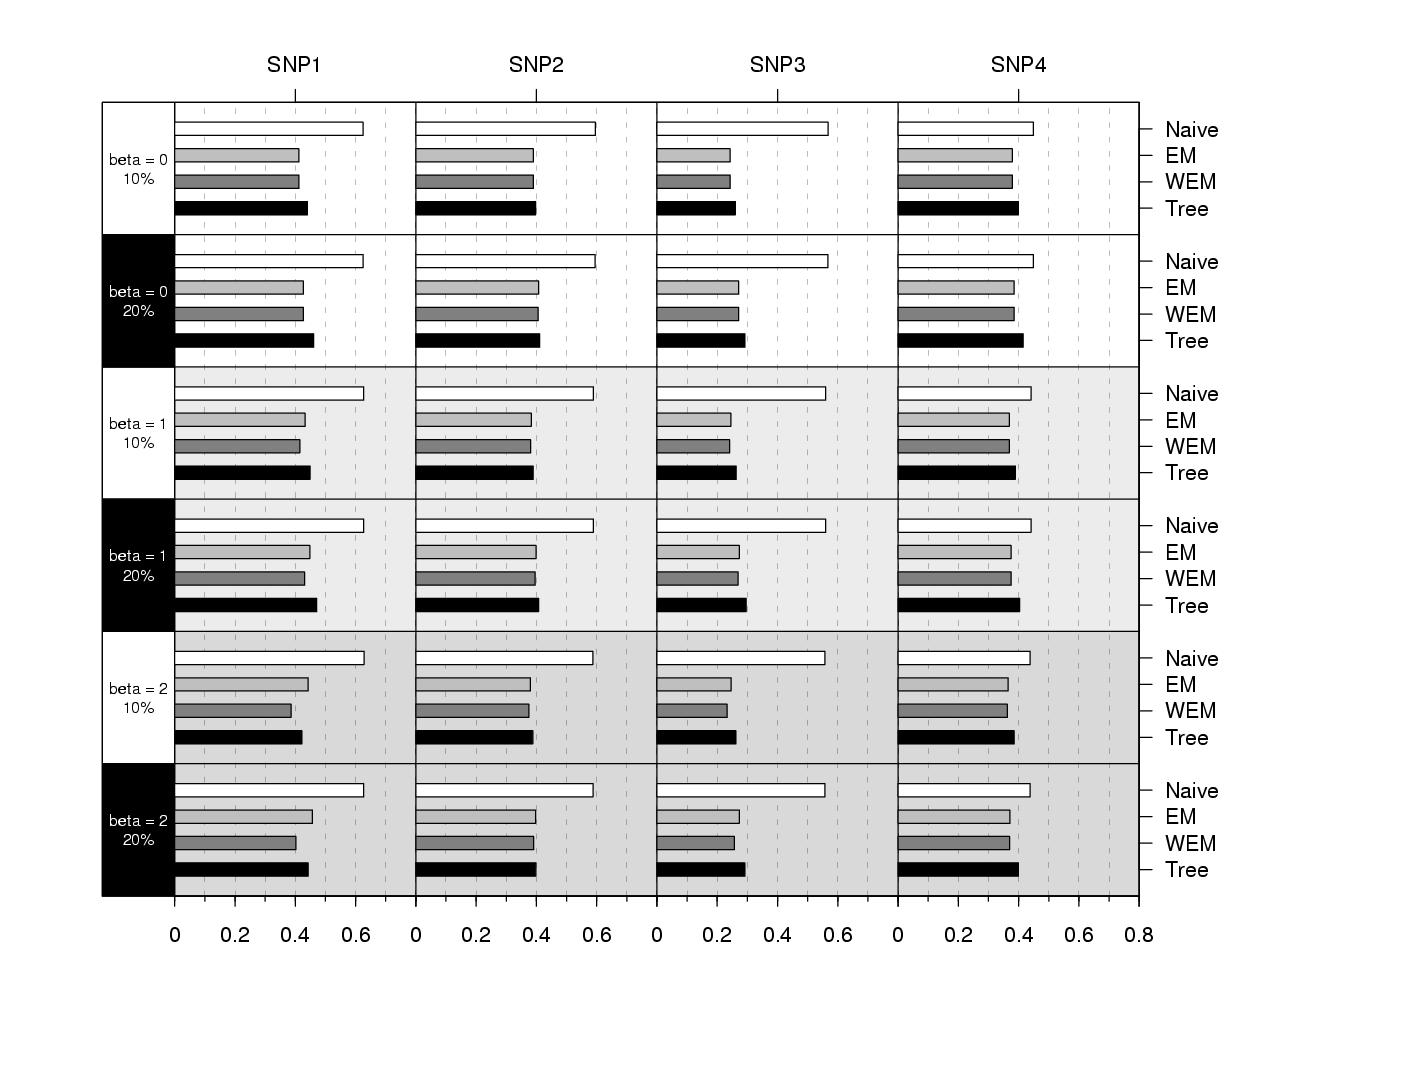
Table 8: A comparison of the imputation error probabilities for the development dyslexia data for the four methods, as given in Table 8 are shown (click on it to enlarge). Download the plot and the data [ jpg | ps | pdf | csv ].

Table 9: The absolute value of the bias, the standard deviation of the parameter estimates, and the root mean squared error as given in Table 9 are shown (click on it to enlarge). Download the plot and the data [ jpg | ps | pdf | csv ].
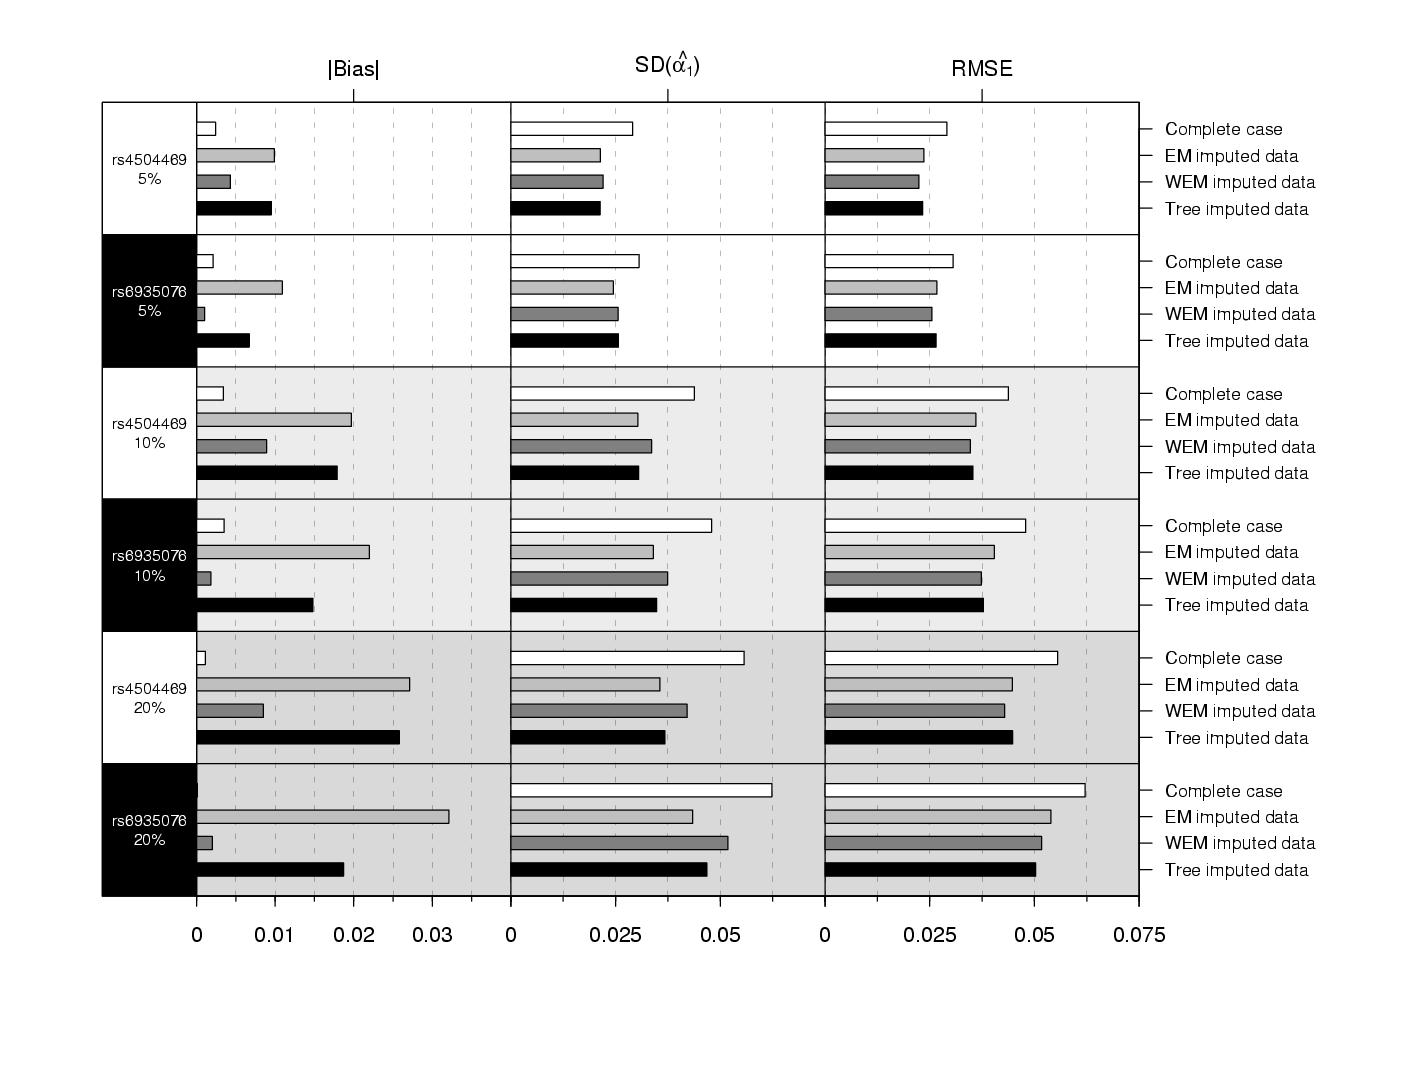
Table 10: The absolute value of the bias, the standard deviation of the parameter estimates, and the root mean squared error as given in Table 10 are shown (click on it to enlarge). Download the plot and the data [ jpg | ps | pdf | csv ].