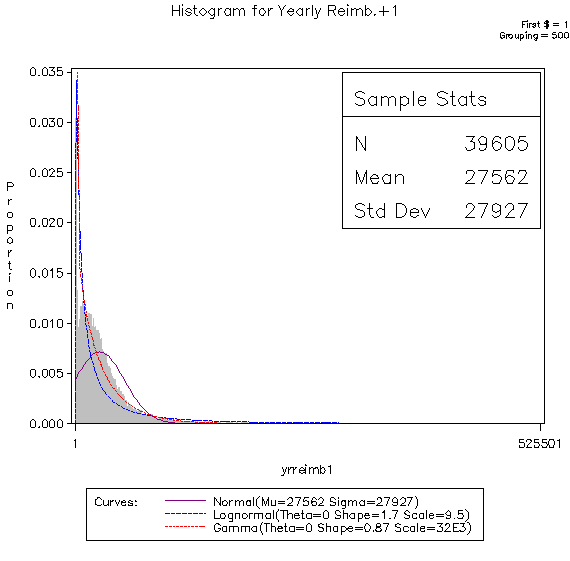
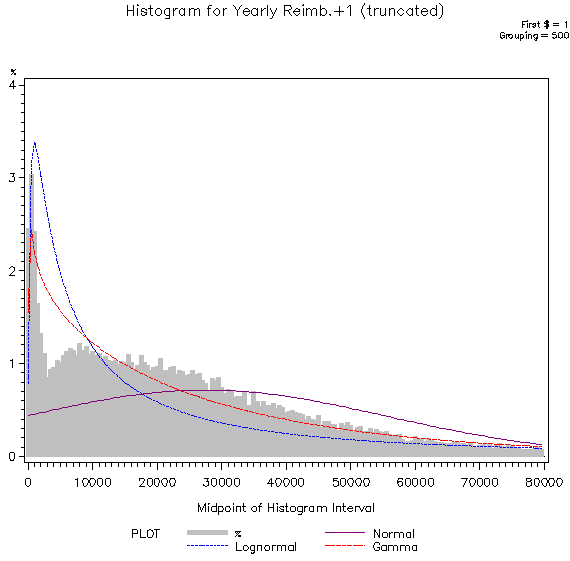
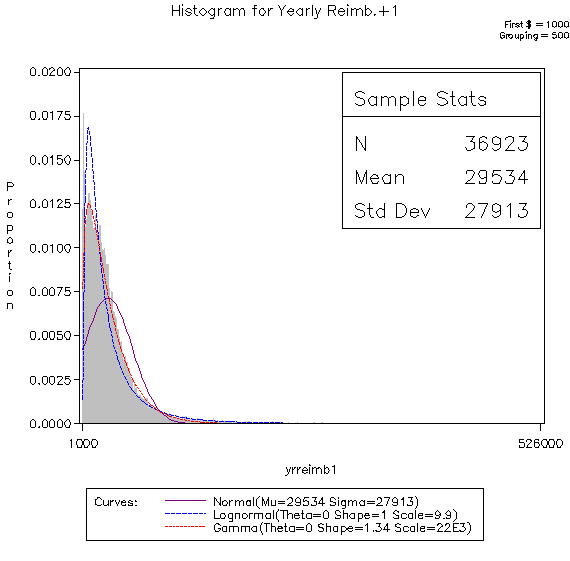
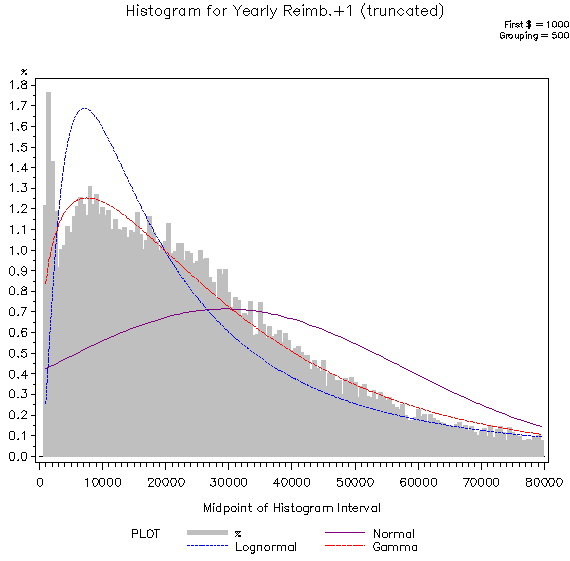
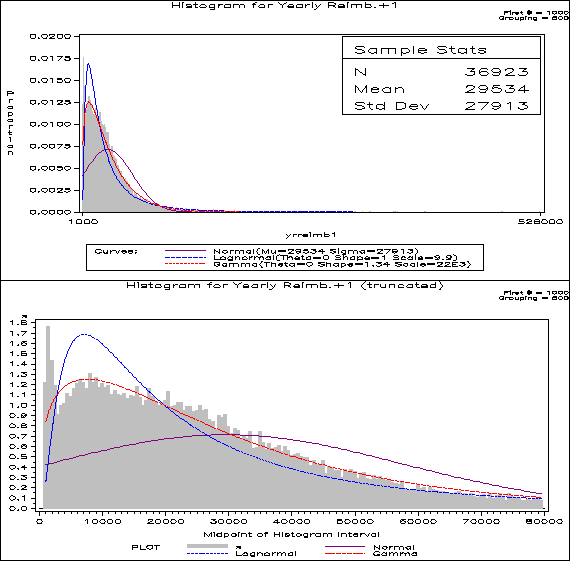
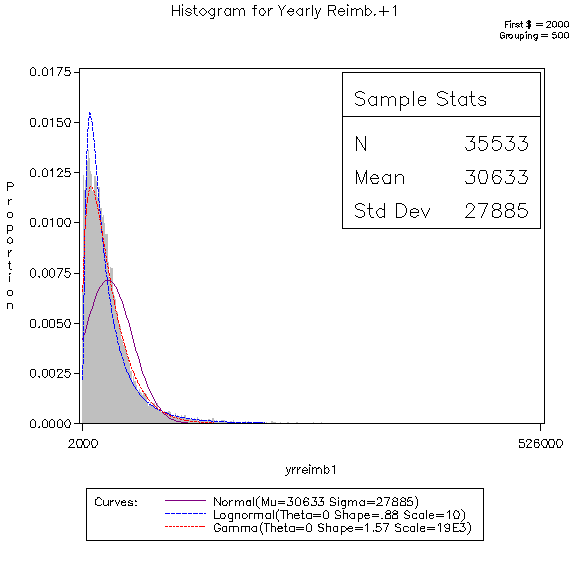
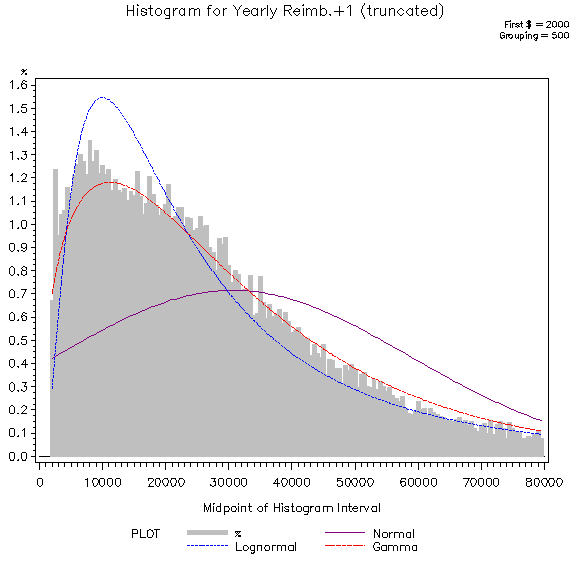
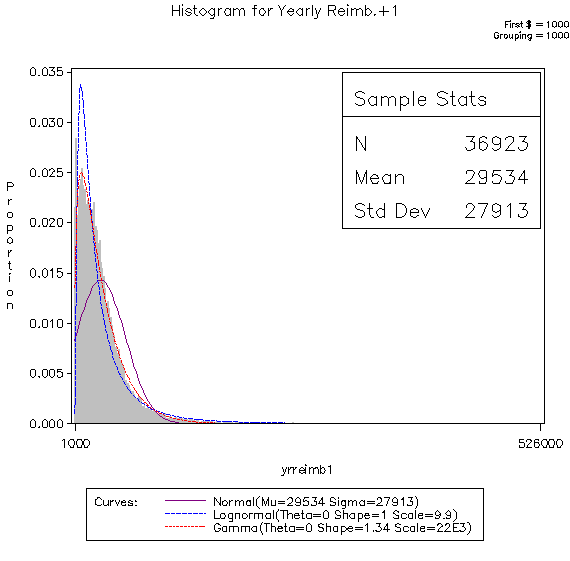
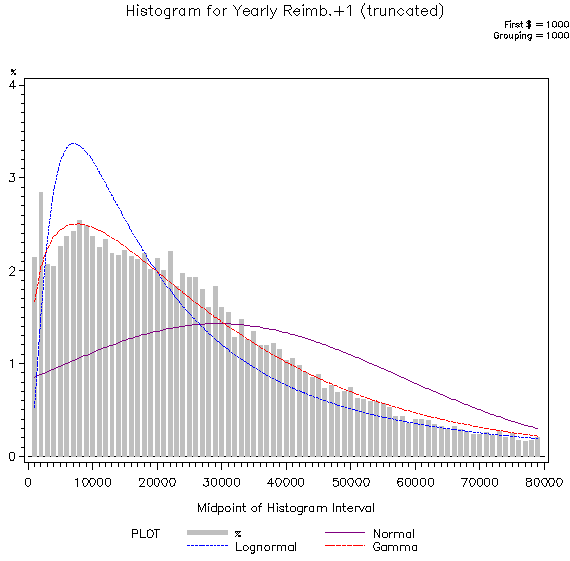
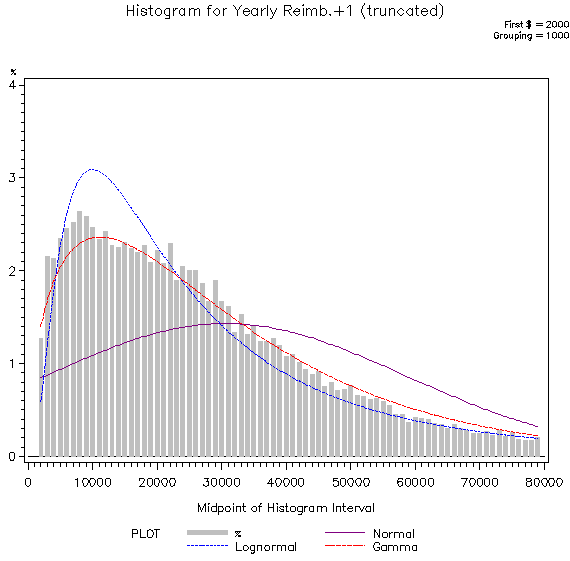
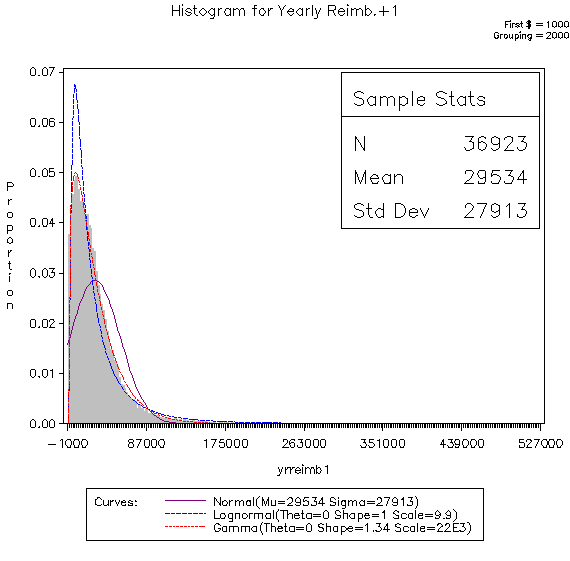
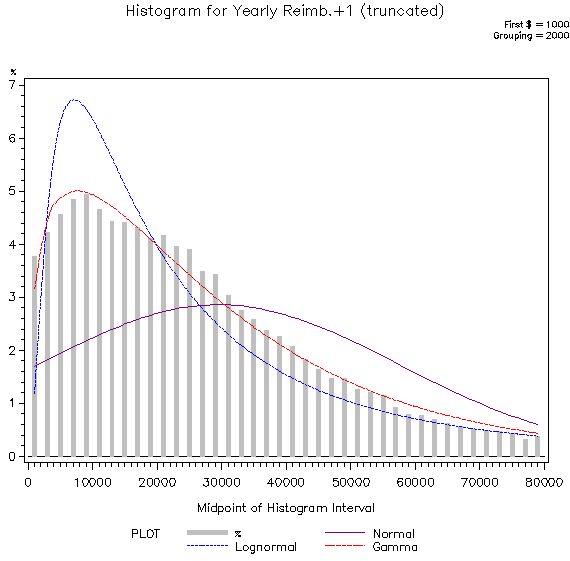
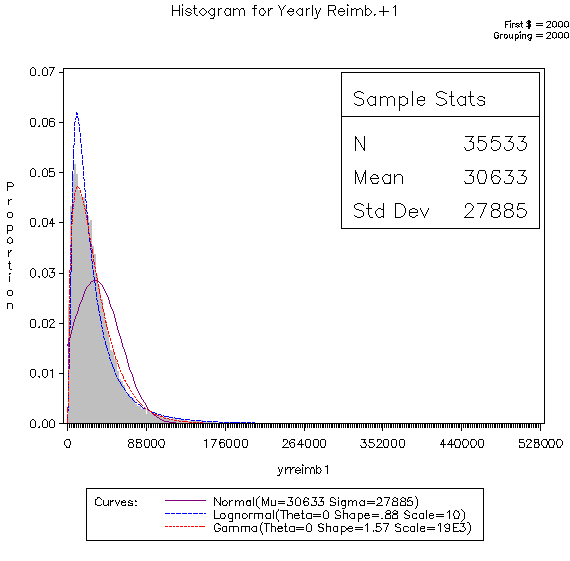
| Simple statistics for (Year Reimb. + 1) |
The UNIVARIATE Procedure
Variable: yrreimb1
Moments
N
39605
Sum Weights
39605
Mean
27562.2655
Sum Observations
1091603524
Std Deviation
27927.0531
Variance
779920295
Skewness
2.93378022
Kurtosis
18.0901714
Uncorrected SS
6.0975E13
Corrected SS
3.0888E13
Coeff Variation
101.323504
Std Error Mean
140.329863
Basic Statistical Measures
Location
Variability
Mean
27562.27
Std Deviation
27927
Median
20989.93
Variance
779920295
Mode
1.00
Range
525244
Interquartile Range
28557
Tests for Location: Mu0=0
Test
Statistic
p Value
Student's t
t
196.4105
Pr > |t|
<.0001
Sign
M
19802.5
Pr >= |M|
<.0001
Signed Rank
S
3.9215E8
Pr >= |S|
<.0001
Quantiles (Definition 5)
Quantile
Estimate
100% Max
525245.02
99%
133075.89
95%
76839.62
90%
58229.67
75% Q3
37397.23
50% Median
20989.93
25% Q1
8840.03
10%
1898.46
5%
668.17
1%
1.00
0% Min
1.00
Extreme Observations
Lowest
Highest
Value
Obs
Value
Obs
1
39570
362193
37209
1
39555
393725
3791
1
39550
393764
4060
1
39479
481641
22224
1
39380
525245
26931
| Lognormal Model |
The GENMOD Procedure
Model Information
Data Set
WORK.LDAT
Distribution
Normal
Link Function
Identity
Dependent Variable
logreimb1
Observations Used
33841
Missing Values
5764
Class Level Information
Class
Levels
Values
race3
3
Other Black White
malerace3
3
0 2 1
seerreg10cat
11
1 2 20 22 23 25 26 27 31 35 21
stage
5
3 1 2 0 4
Criteria For Assessing Goodness Of Fit
Criterion
DF
Value
Value/DF
Deviance
34E3
91878.8413
2.7151
Scaled Deviance
34E3
33841.0000
1.0000
Pearson Chi-Square
34E3
91878.8413
2.7151
Scaled Pearson X2
34E3
33841.0000
1.0000
Log Likelihood
-64918.4551
Algorithm converged.
Analysis Of Parameter Estimates
Parameter
DF
Estimate
Standard Error
Wald 95% Confidence Limits
Chi-Square
Pr > ChiSq
Intercept
1
9.5560
0.0090
9.5384
9.5735
1138209
<.0001
Scale
1
1.6477
0.0063
1.6354
1.6602
NOTE:
The scale parameter was estimated by maximum likelihood.
LR Statistics For Type 1 Analysis
Source
2*LogLikelihood
DF
Chi-Square
Pr > ChiSq
Intercept
-129836.91
| Gamma Model |
The GENMOD Procedure
Model Information
Data Set
NCI.CR90P
Distribution
Gamma
Link Function
Log
Dependent Variable
yrreimb1
Observations Used
33841
Missing Values
5764
Class Level Information
Class
Levels
Values
race3
3
Other Black White
malerace3
3
0 2 1
seerreg10cat
11
1 2 20 22 23 25 26 27 31 35 21
stage
5
3 1 2 0 4
Criteria For Assessing Goodness Of Fit
Criterion
DF
Value
Value/DF
Deviance
34E3
44824.4614
1.3246
Scaled Deviance
34E3
39652.7643
1.1718
Pearson Chi-Square
34E3
34067.2328
1.0067
Scaled Pearson X2
34E3
30136.6689
0.8906
Log Likelihood
-379463.9207
Algorithm converged.
Analysis Of Parameter Estimates
Parameter
DF
Estimate
Standard Error
Wald 95% Confidence Limits
Chi-Square
Pr > ChiSq
Intercept
1
10.2183
0.0058
10.2069
10.2296
3125763
<.0001
Scale
1
0.8846
0.0059
0.8731
0.8963
NOTE:
The scale parameter was estimated by maximum likelihood.
LR Statistics For Type 1 Analysis
Source
2*LogLikelihood
DF
Chi-Square
Pr > ChiSq
Intercept
-758927.84
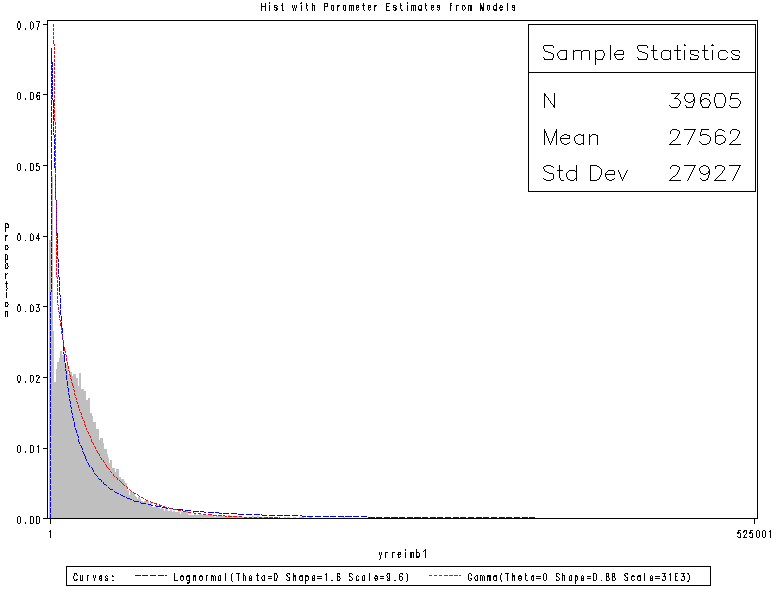
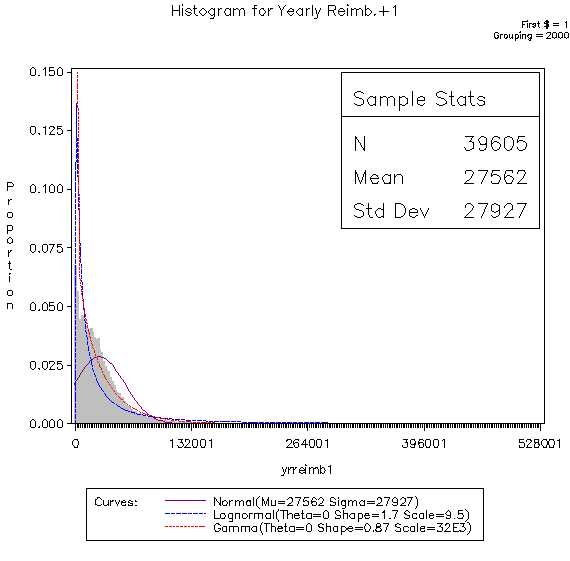
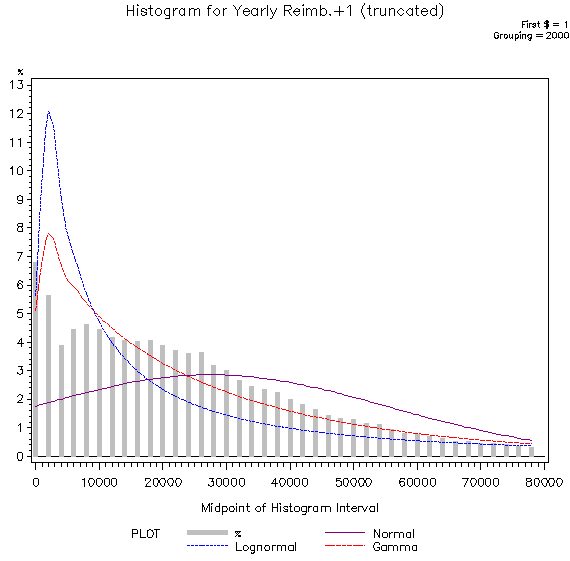
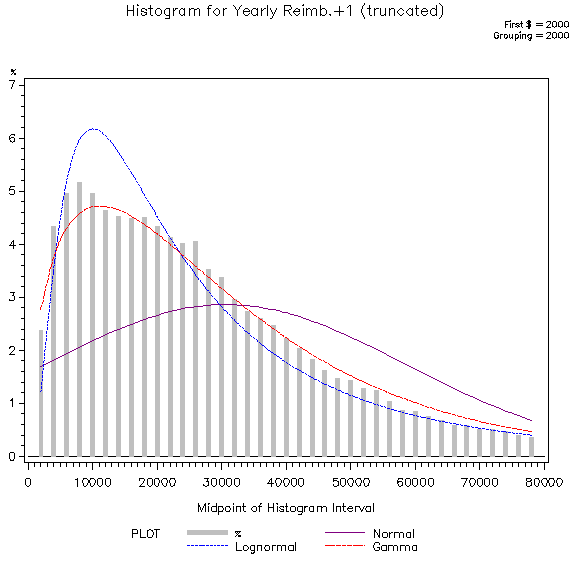
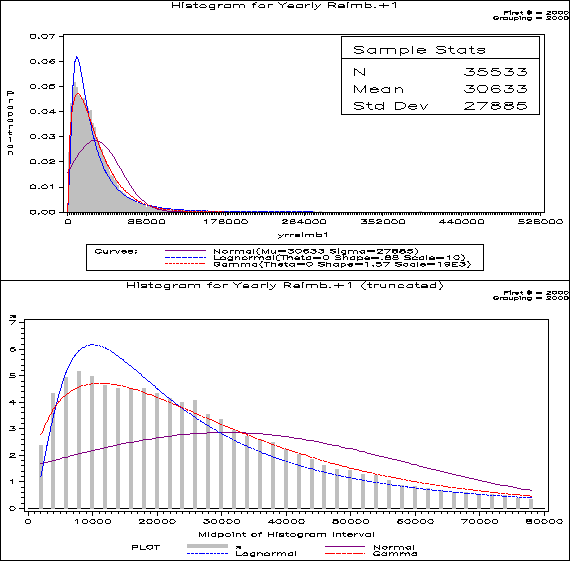
| Hist with Parameter Estimates from Models |
The CAPABILITY Procedure
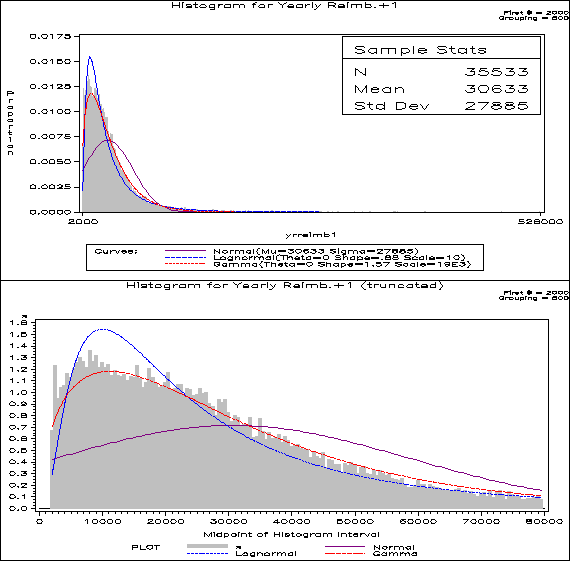
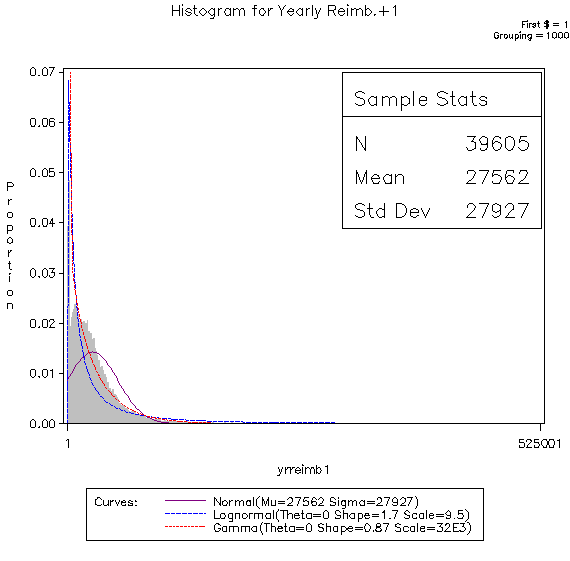
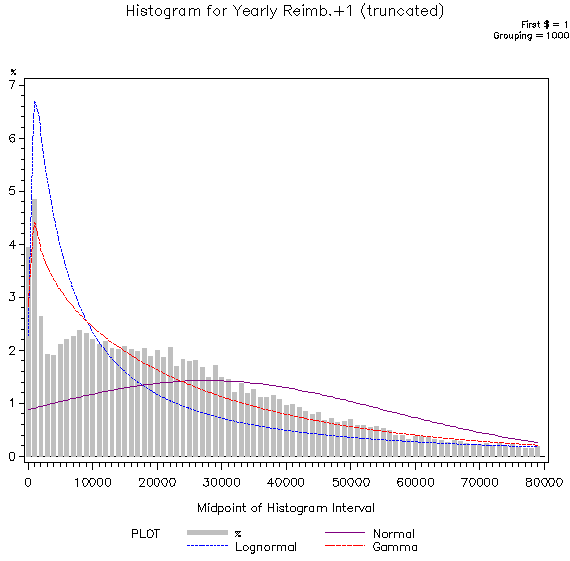
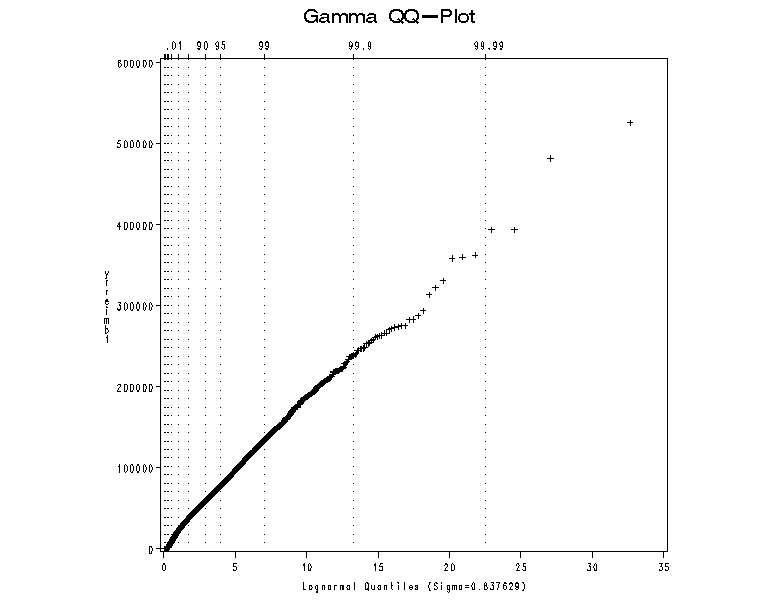
Fitted Lognormal Distribution for yrreimb1
Parameters for Lognormal Distribution
Parameter
Symbol
Estimate
Threshold
Theta
0
Scale
Zeta
9.555987
Shape
Sigma
1.64773
Mean
54912.41
Std Dev
206231.3
Goodness-of-Fit Tests for Lognormal Distribution
Test
Statistic
DF
p Value
Kolmogorov-Smirnov
D
0.1420
Pr > D
<0.001
Cramer-von Mises
W-Sq
317.8294
Pr > W-Sq
<0.001
Anderson-Darling
A-Sq
1784.7441
Pr > A-Sq
<0.001
Chi-Square
Chi-Sq
14305.4892
525
Pr > Chi-Sq
<0.001
Quantiles for Lognormal Distribution
Percent
Quantile
Observed
Estimated
1.0
1.0000
305.758
5.0
668.1700
939.842
10.0
1898.4600
1710.148
25.0
8840.0300
4649.940
50.0
20989.9300
14129.029
75.0
37397.2300
42931.627
90.0
58229.6700
116732.268
95.0
76839.6200
212407.557
99.0
133075.8900
652901.107
| Hist with Parameter Estimates from Models |
The CAPABILITY Procedure
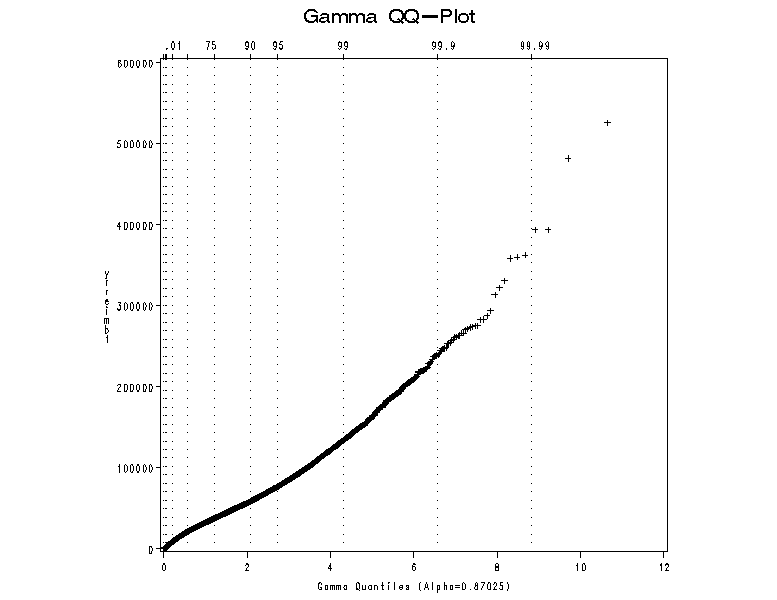
Fitted Gamma Distribution for yrreimb1
Parameters for Gamma Distribution
Parameter
Symbol
Estimate
Threshold
Theta
0
Scale
Sigma
30972.67
Shape
Alpha
0.884623
Mean
27399.15
Std Dev
29131.17
Goodness-of-Fit Tests for Gamma Distribution
Test
Statistic
DF
p Value
Kolmogorov-Smirnov
D
0.06268
Pr > D
<0.001
Cramer-von Mises
W-Sq
53.00534
Pr > W-Sq
<0.001
Anderson-Darling
A-Sq
283.22579
Pr > A-Sq
<0.001
Chi-Square
Chi-Sq
4804.84455
525
Pr > Chi-Sq
<0.001
Quantiles for Gamma Distribution
Percent
Quantile
Observed
Estimated
1.0
1.0000
162.012
5.0
668.1700
1013.901
10.0
1898.4600
2267.371
25.0
8840.0300
6900.834
50.0
20989.9300
18026.098
75.0
37397.2300
37964.744
90.0
58229.6700
65016.272
95.0
76839.6200
85735.899
99.0
133075.8900
134287.106
