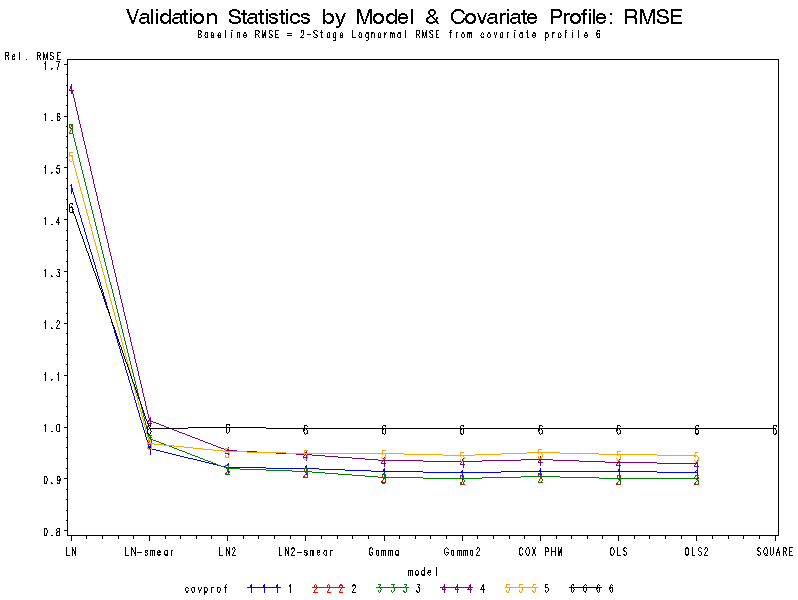
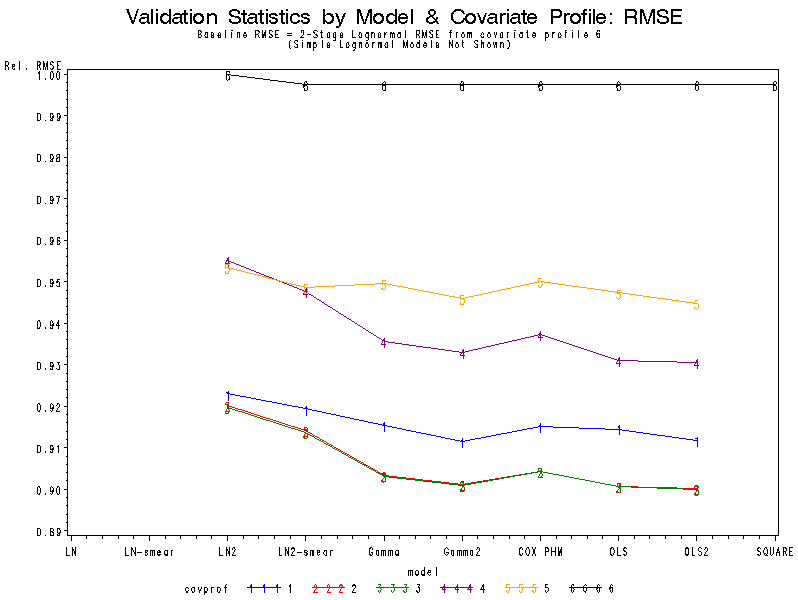
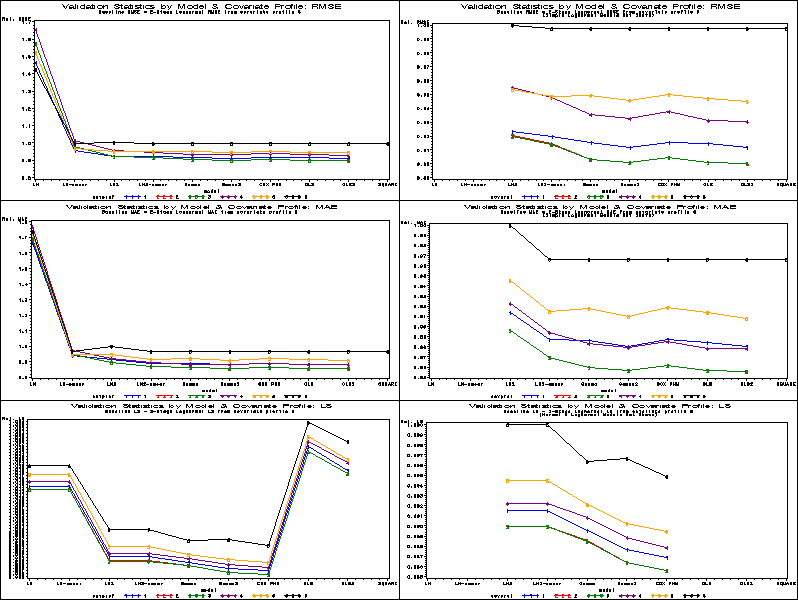
| Validation Statistics by Model & Covariate Profile: RMSE |
Obs
model
rmse1
rmse2
rmse3
rmse4
rmse5
rmse6
1
LN
40965.78
44143.11
44140.78
46334.11
42659.54
39903.07
2
LN-smear
26814.37
27396.24
27376.38
28372.55
27108.10
27920.31
3
LN2
25836.31
25759.70
25742.82
26736.62
26686.98
27992.41
4
LN2-smear
25734.89
25592.52
25576.63
26527.84
26554.11
27920.17
5
Gamma
25619.94
25285.54
25280.53
26189.71
26580.41
27920.31
6
Gamma2
25514.38
25224.92
25216.77
26116.23
26479.03
27920.17
7
COX PHM
25617.47
25316.03
25310.01
26239.21
26596.56
27921.11
8
OLS
25598.61
25213.40
25209.16
26062.31
26517.01
27920.31
9
OLS2
25525.25
25201.48
25193.06
26047.79
26447.64
27920.17
10
SQUARE
.
.
.
.
.
27920.07
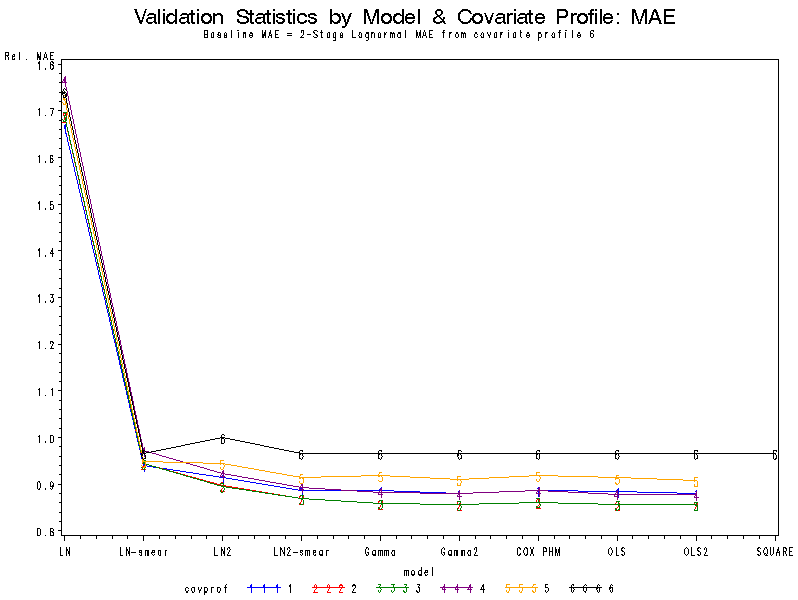
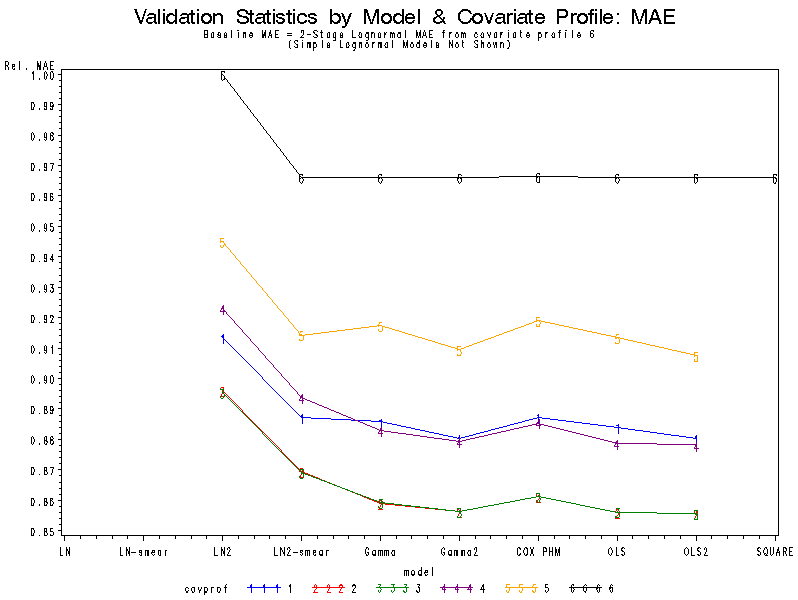
| Validation Statistics by Model & Covariate Profile: MAE |
Obs
model
mae1
mae2
mae3
mae4
mae5
mae6
1
LN
33255.27
33723.27
33744.05
35280.73
34474.89
34755.06
2
LN-smear
18786.29
18834.32
18857.05
19396.49
18935.00
19289.42
3
LN2
18235.67
17890.69
17880.52
18425.93
18868.79
19965.41
4
LN2-smear
17713.11
17357.54
17351.43
17844.81
18254.35
19290.62
5
Gamma
17684.75
17151.67
17156.70
17624.94
18317.61
19289.42
6
Gamma2
17576.62
17094.82
17094.27
17557.27
18158.25
19290.62
7
COX PHM
17714.84
17195.08
17197.79
17677.19
18348.61
19294.85
8
OLS
17648.70
17091.64
17092.94
17543.91
18235.63
19289.42
9
OLS2
17576.16
17086.33
17081.96
17533.50
18120.11
19290.62
10
SQUARE
.
.
.
.
.
19289.62
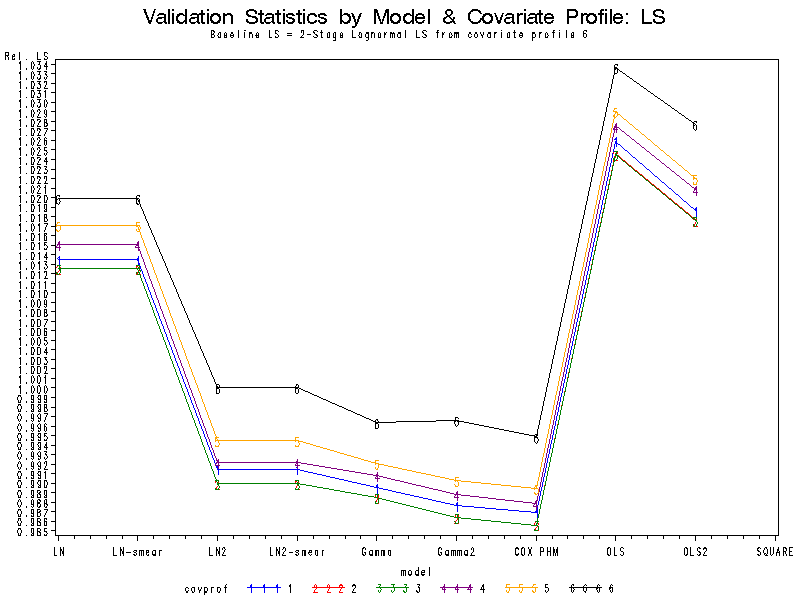
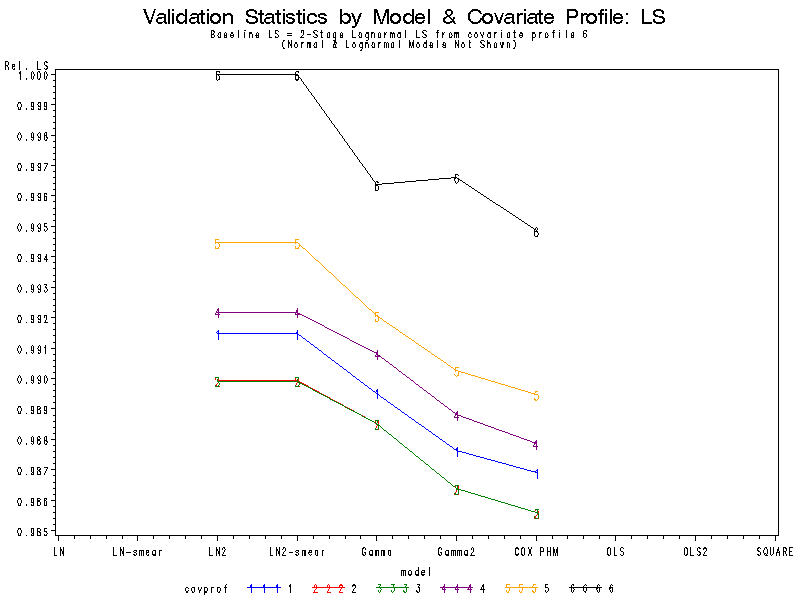
| Validation Statistics by Model & Covariate Profile: LS |
Obs
model
ls1
ls2
ls3
ls4
ls5
ls6
1
LN
11.4280
11.4174
11.4179
11.4463
11.4686
11.5003
2
LN-smear
11.4280
11.4174
11.4179
11.4463
11.4686
11.5003
3
LN2
11.1799
11.1626
11.1623
11.1878
11.2135
11.2760
4
LN2-smear
11.1799
11.1626
11.1623
11.1878
11.2135
11.2760
5
Gamma
11.1579
11.1464
11.1464
11.1724
11.1866
11.2350
6
Gamma2
11.1365
11.1226
11.1224
11.1499
11.1663
11.2377
7
COX PHM
11.1285
11.1136
11.1135
11.1390
11.1574
11.2180
8
OLS
11.5684
11.5531
11.5530
11.5864
11.6037
11.6554
9
OLS2
11.4860
11.4751
11.4747
11.5111
11.5241
11.5885
10
SQUARE
.
.
.
.
.
.
