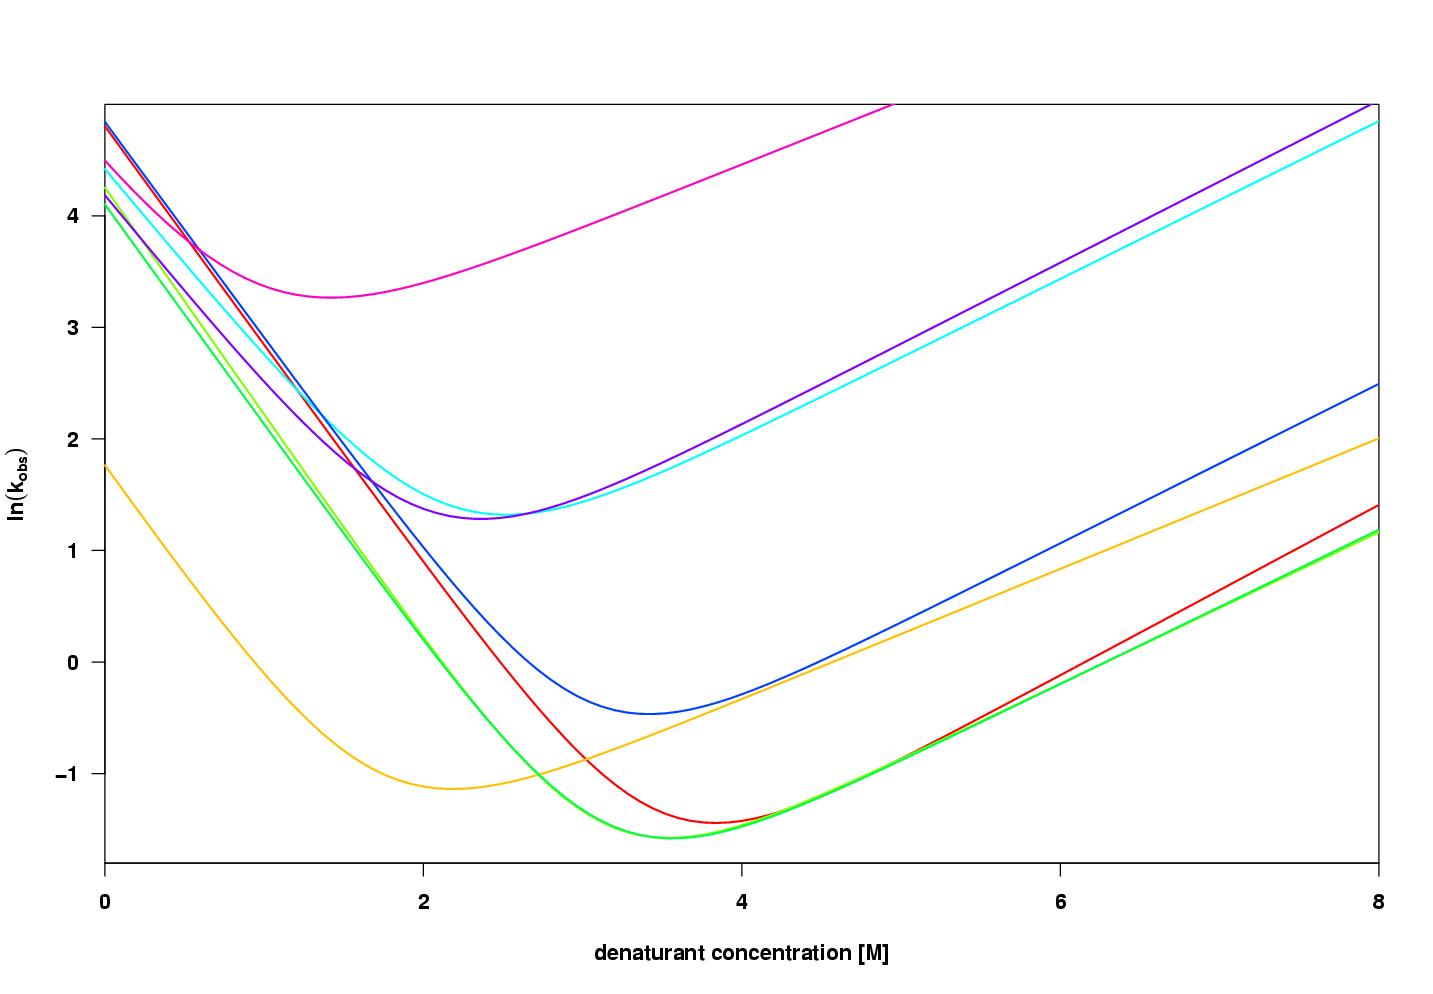
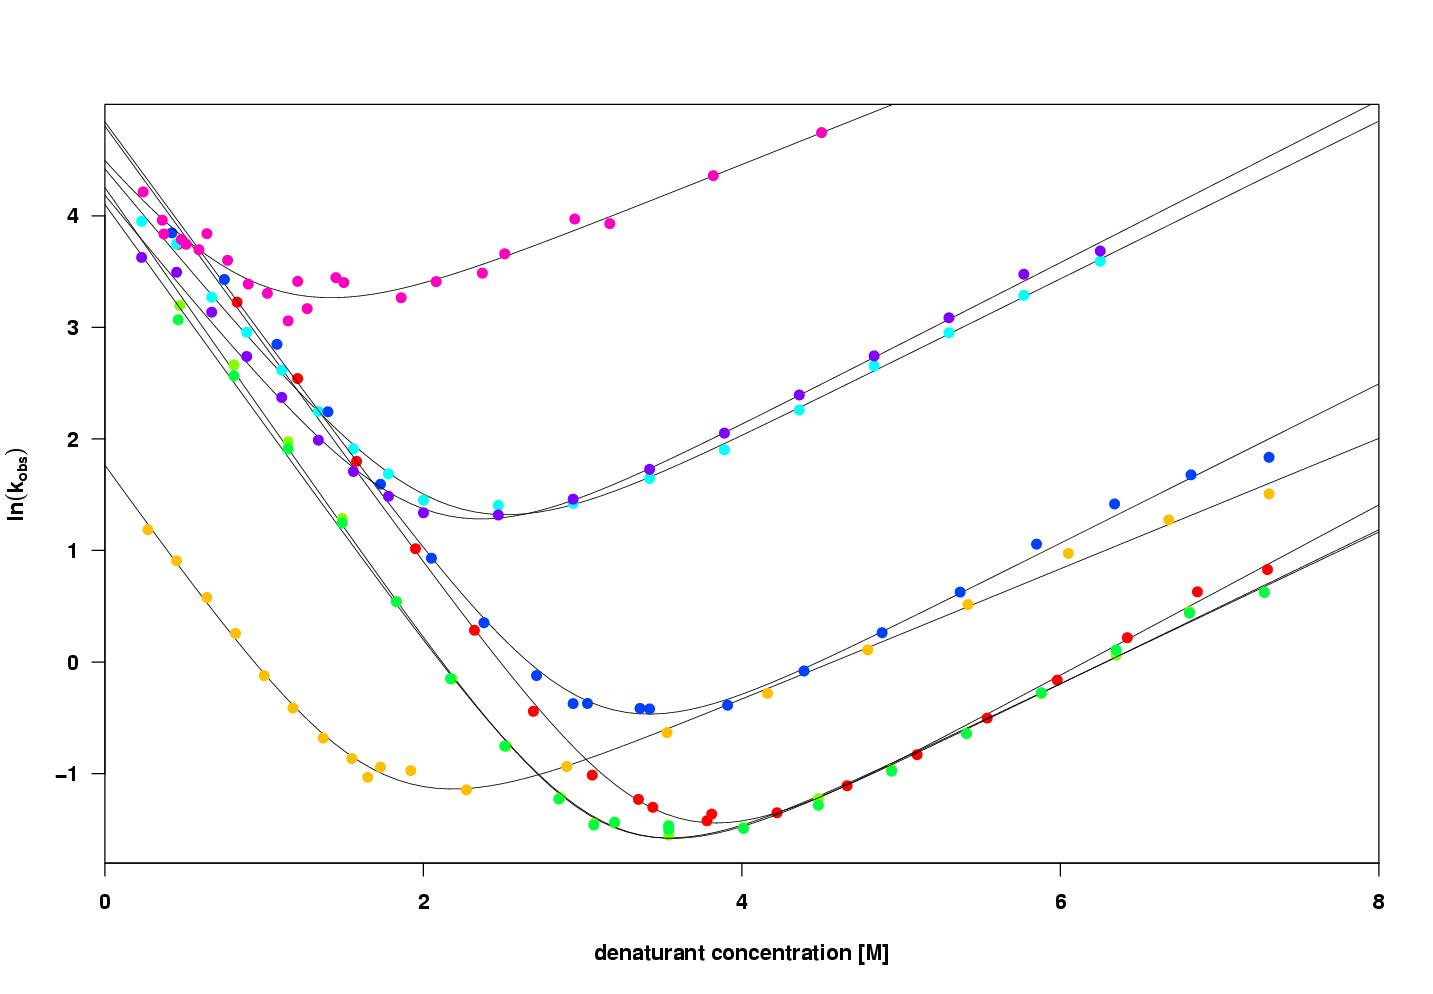
Table 1: Estimates for the kinetic parameters. The energies are given in kJ .
| log(kf) | selog(kf) | mf | semf | log(ku) | selog(ku) | mu | semu | ΔGu | seΔGu | meq | semeq | |
| WT | 4.80 | 0.06 | -4.86 | 0.08 | -4.70 | 0.13 | 1.89 | 0.06 | 23.56 | 0.20 | -6.75 | 0.07 |
| I28A | 1.75 | 0.06 | -4.97 | 0.16 | -2.67 | 0.08 | 1.45 | 0.04 | 10.97 | 0.12 | -6.42 | 0.15 |
| I28L | 4.25 | 0.05 | -5.05 | 0.08 | -4.27 | 0.10 | 1.68 | 0.04 | 21.13 | 0.15 | -6.74 | 0.07 |
| I28V | 4.10 | 0.06 | -4.89 | 0.09 | -4.34 | 0.13 | 1.71 | 0.06 | 20.94 | 0.19 | -6.61 | 0.08 |
| V55A | 4.41 | 0.04 | -4.26 | 0.10 | -0.81 | 0.08 | 1.75 | 0.04 | 12.94 | 0.12 | -6.01 | 0.09 |
| V55M | 4.84 | 0.08 | -4.80 | 0.12 | -3.22 | 0.15 | 1.77 | 0.06 | 19.99 | 0.22 | -6.57 | 0.10 |
| V55T | 4.18 | 0.06 | -4.33 | 0.14 | -0.78 | 0.10 | 1.80 | 0.05 | 12.30 | 0.16 | -6.13 | 0.13 |
| V55G | 4.39 | 0.12 | -4.45 | 0.72 | 2.18 | 0.18 | 1.41 | 0.14 | 5.47 | 0.27 | -5.86 | 0.62 |
A spread sheet with the above data for download is here. The file is in csv format, which can directly be read, for example, into R and Excel.
Table 2: Estimates for the Φ values and the changes in free energy. The energies are given in kJ .
| Φ | seΦ | lower | upper | ΔΔGT | seΔΔGT | ΔΔGN | seΔΔGN | ρΔΔGTΔΔGN | |
| WT-I28A | 0.60 | 0.02 | 0.56 | 0.64 | 7.56 | 0.20 | 12.59 | 0.37 | 0.20 |
| WT-I28L | 0.56 | 0.11 | 0.33 | 0.80 | 1.36 | 0.20 | 2.43 | 0.40 | 0.13 |
| WT-I28V | 0.66 | 0.13 | 0.40 | 0.92 | 1.74 | 0.21 | 2.62 | 0.43 | 0.13 |
| WT-V55A | 0.09 | 0.02 | 0.06 | 0.12 | 0.96 | 0.18 | 10.62 | 0.37 | 0.12 |
| WT-V55M | -0.03 | 0.07 | -0.16 | 0.11 | -0.10 | 0.24 | 3.57 | 0.47 | 0.14 |
| WT-V55T | 0.14 | 0.02 | 0.10 | 0.17 | 1.55 | 0.20 | 11.26 | 0.40 | 0.15 |
| WT-V55G | 0.06 | 0.02 | 0.02 | 0.09 | 1.02 | 0.33 | 18.09 | 0.52 | 0.20 |
A spread sheet with the above data for download is here. The file is also csv format.
The two small figures below show the fitted chevron curves with and without the data superimposed. Click on the figures to enlarge and/or save the jpgs of the plots. To get the color identifiers, click here.