Welcome
Accuracy vs Droprate (ADP) plots
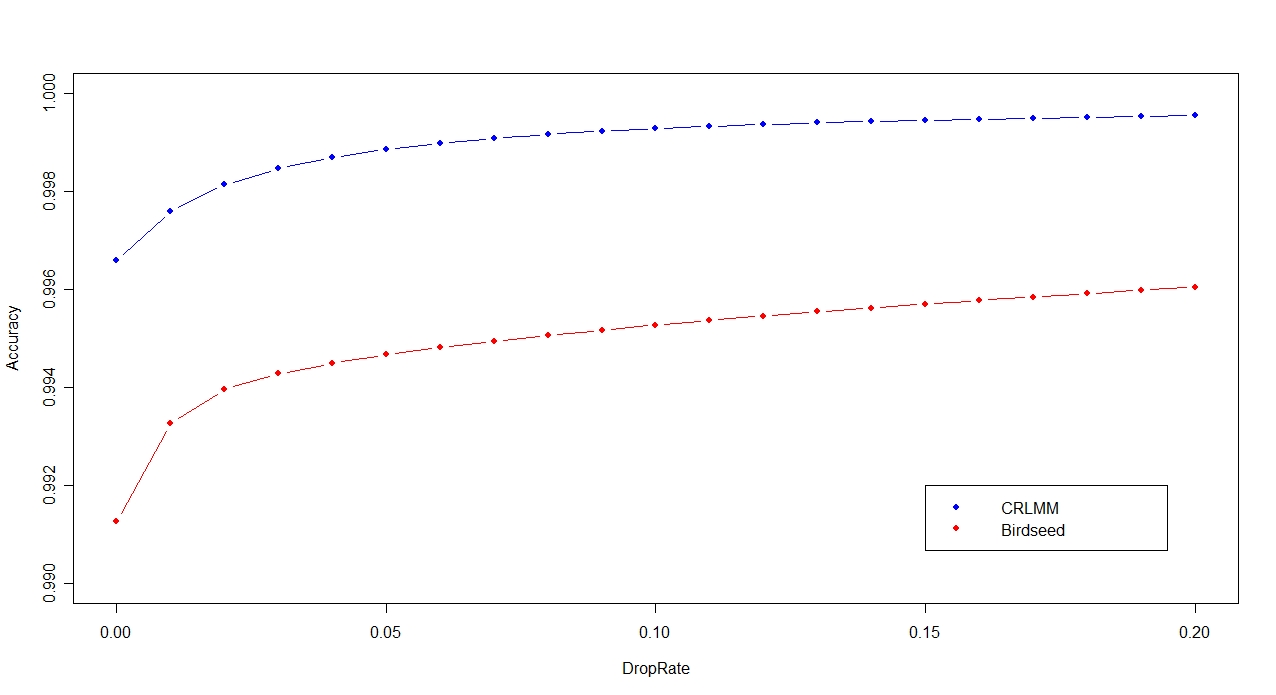
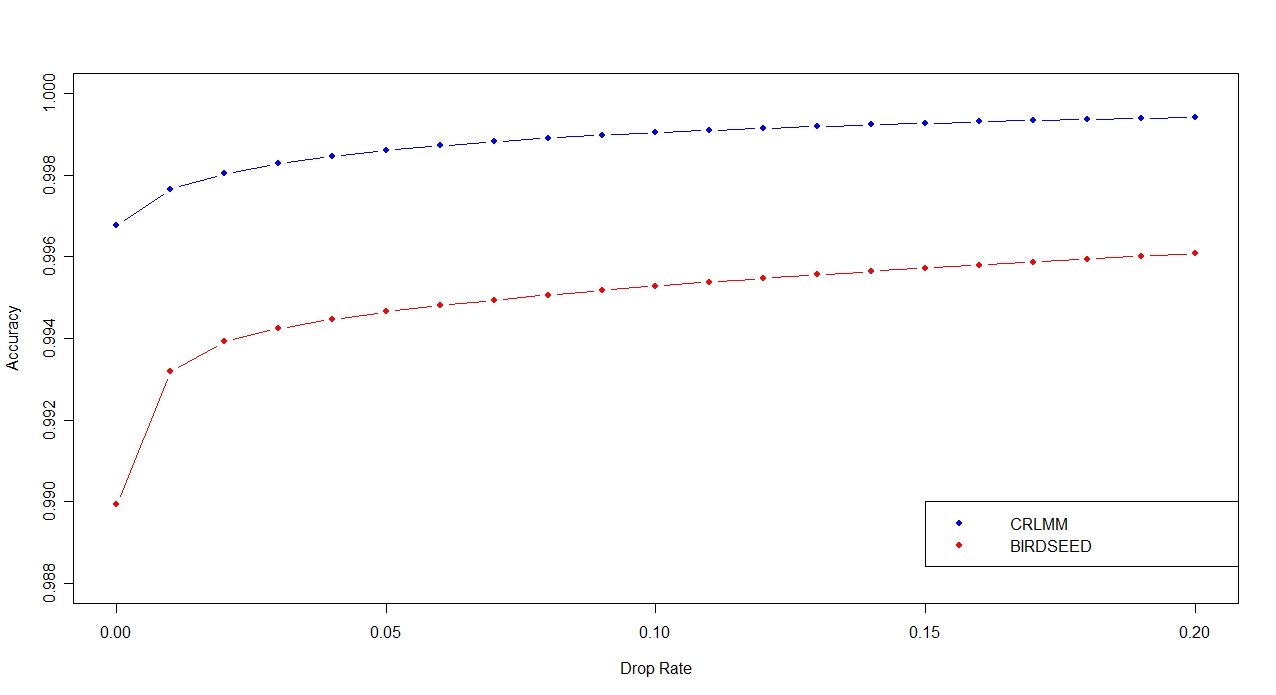
Figure 1(Click on Figure to see larger image)
Accuracy vs Drop rate plot (ADPs) for CRLMM and Birdseed. Drop rates
between 0 and 20% are examined. Each point in the graph represents the proportion of
calls above the given quality threshold in agreement with the HapMap Project. The Yaxis
is the drop rate and the X-axis is the accuracy. ADPs are plotted for 54 Genetic
Association Information Network (GAIN) samples from Affymetrix for the Affy SNP 6.0
platform
Figure 2(Click on Figure to see larger image)
Accuracy vs Drop rate plot (ADPs) for CRLMM and Birdseed. Drop rates
between 0 and 20% are examined. Each point in the graph represents the proportion of
calls above the given quality threshold in agreement with the HapMap Project. The Yaxis
is the drop rate and the X-axis is the accuracy. ADPs are plotted for 96 Chakravarti
HapMap 6.0 first pass array samples for the Affy SNP 6.0 platform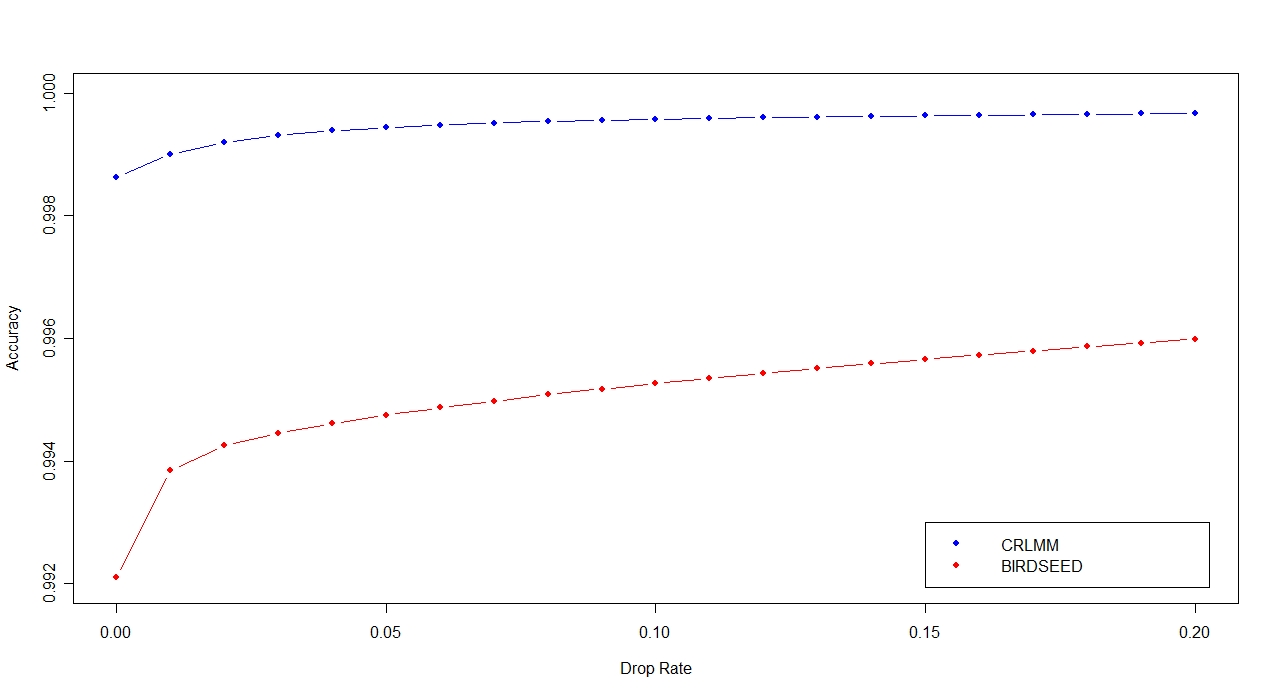
Figure 3(Click on Figure to see larger image)
Accuracy vs Drop rate plot (ADPs) for CRLMM and Birdseed. Drop rates
between 0 and 20% are examined. Each point in the graph represents the proportion of
calls above the given quality threshold in agreement with the HapMap Project. The Yaxis
is the drop rate and the X-axis is the accuracy. ADPs are plotted for 24 Chakravarti
HapMap 6.0 first pass array samples for the Affy SNP 6.0 platform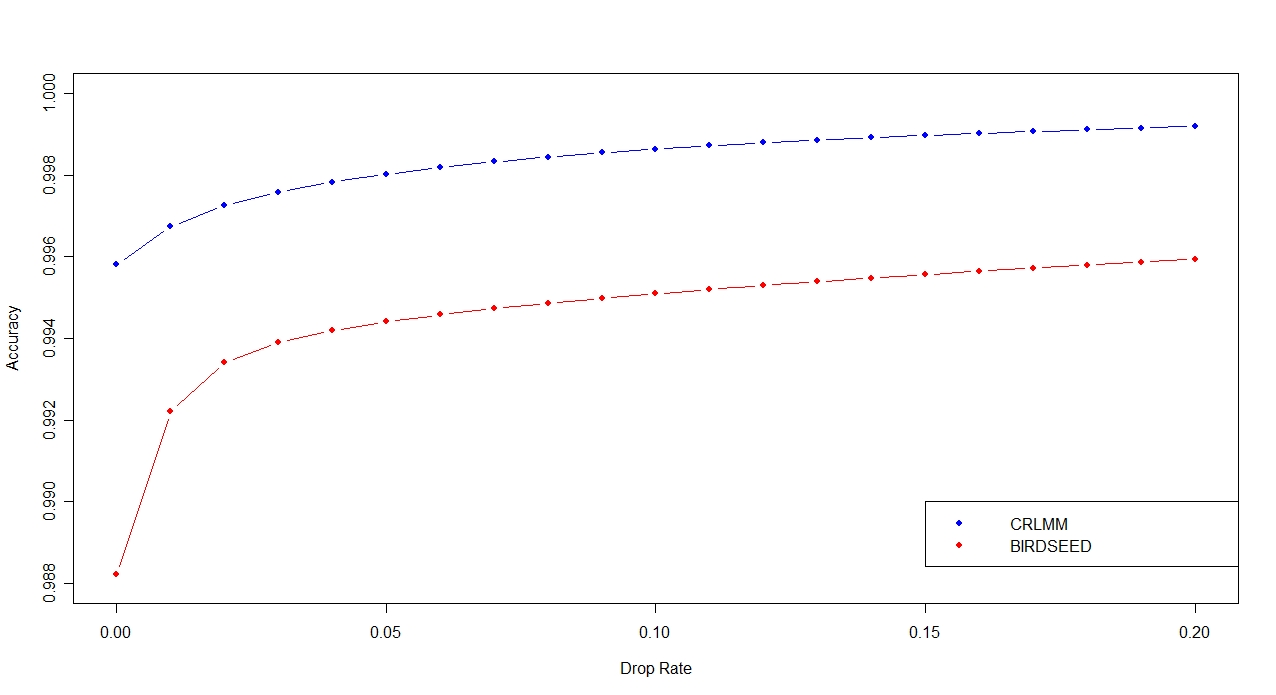
Figure 4(Click on Figure to see larger image)
Accuracy vs Drop rate plot (ADPs) for CRLMM and Birdseed. Drop rates
between 0 and 20% are examined. Each point in the graph represents the proportion of
calls above the given quality threshold in agreement with the HapMap Project. The Yaxis
is the drop rate and the X-axis is the accuracy. ADPs are plotted for 50 Broad
HapMap 500k (nsp) first pass array samples for the Affy 500k (nsp) platform