Welcome
Accuracy vs Shift Plots
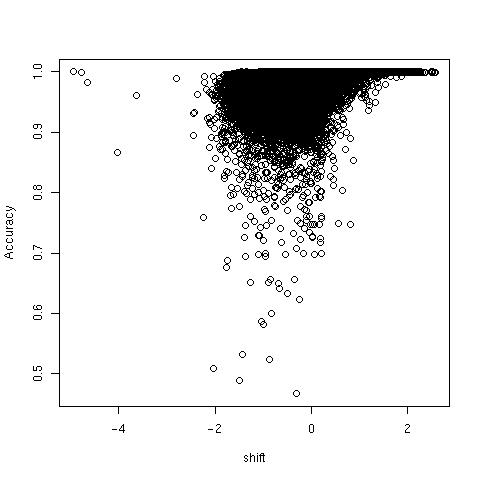
Figure 14 (Click on Figure to see larger image)
Accuracy vs shift plotted for AA (left) and BB (Right) genotypes plotted for
54 samples of Genetic Association Information Network (GAIN) from Affymetrix for the
Affy SNP 6.0 platform. The plots show how accuracy changes relative to the shift coming
from the genotype regions. This has been done only for CRLMM. The red lines indicate
the loess smoother. In both cases, coefficient for shift was significant P<2e-16