Welcome
Cluster plots
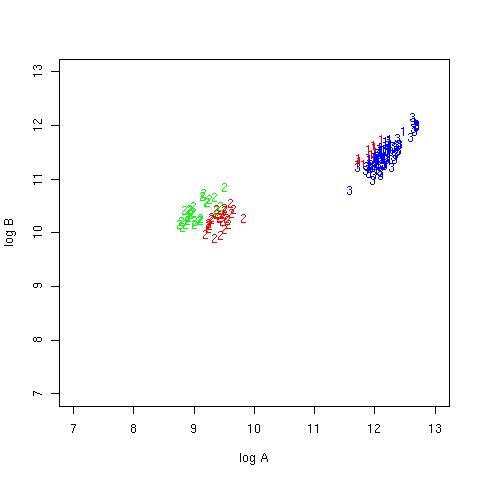
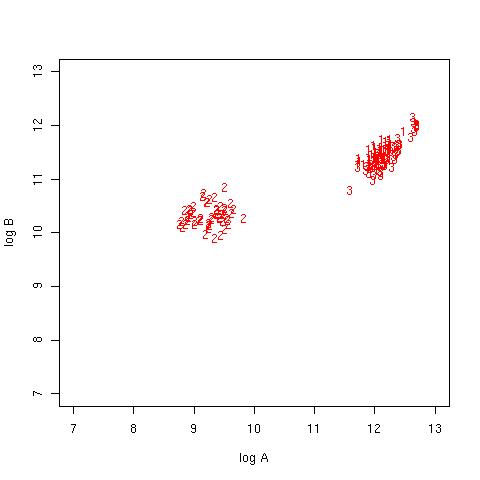
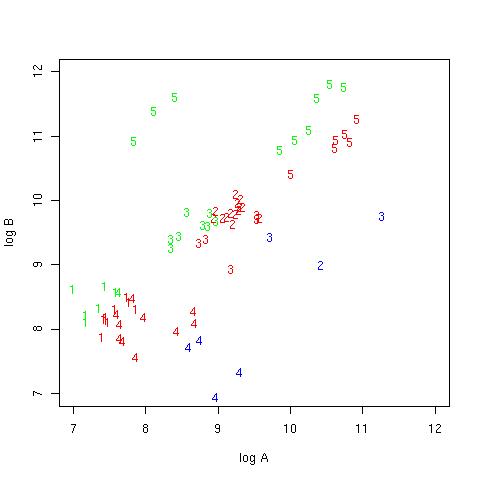
Figure 8(Click on Figure to see larger image)
Cluster plots for CRLMM (Left) and Birdseed (Right) plotted for 54 Genetic
Association Information Network (GAIN) samples from Affymetrix for the Affy SNP 6.0
platform. The plots plot logA (X-axis) and log B(Y-axis) where A and B are the
intensities for alleles A and B respectively. Ellipses are drawn for the genotype regions
for Birdseed from the file generated from Birdseed giving for each SNP, the means and
the covariance matrix for A and B. The SNPs are represented by numbers and the colors
represent the genotypes (Blue=AA, Red=AB, Green=BB)
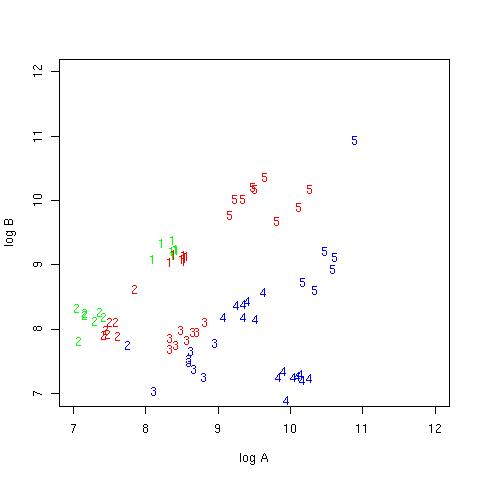
Figure 9(Click on Figure to see larger image)
Cluster plots for CRLMM (with spline correction)(Left) and CRLMM (without
spline correction) (Right) plotted for 54 Genetic Association Information Network
(GAIN) samples from Affymetrix for the Affy SNP 6.0 platform. The plots plot logA (Xaxis)
and log B(Y-axis) where A and B are the intensities for alleles A and B
respectively. The SNPs are represented by numbers and the colors represent the
genotypes (Blue=AA, Red=AB, Green=BB)
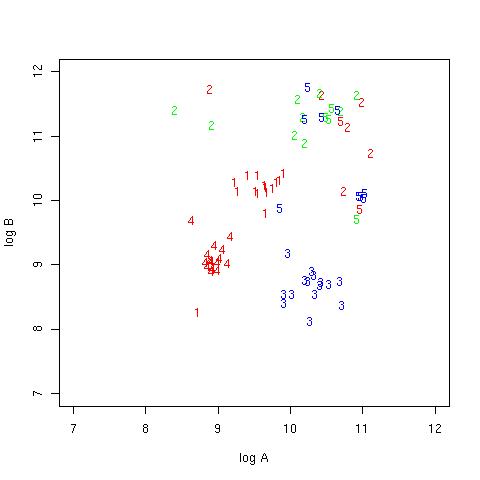
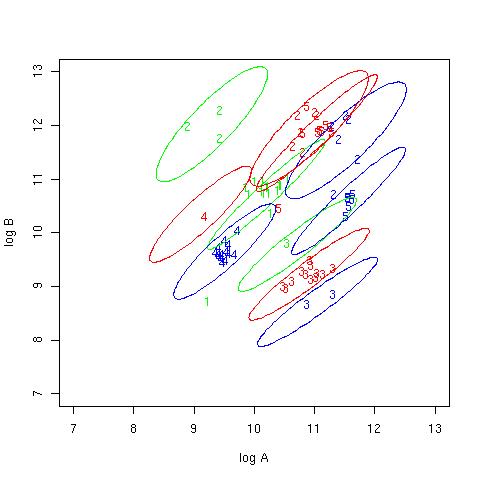
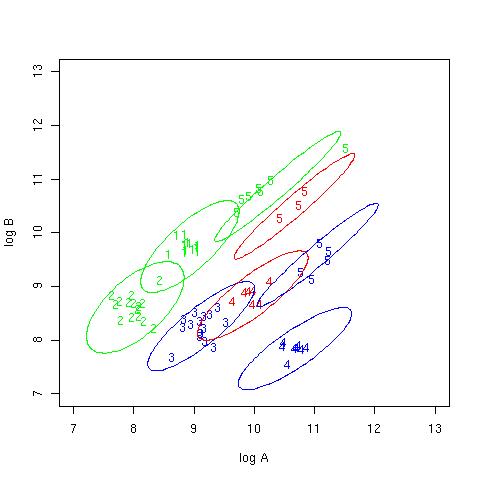
Figure 10 (Click on Figure to see larger image)
Cluster plots for CRLMM (Left) and Birdseed (Right) plotted for 45 Genetics
of Kidneys in Diabetes (GoKinD) samples from Genetic Association Information
Network (GAIN) from Affymetrix for the Affy SNP 5.0 platform. These samples have 3
different kinds of plates with 15 samples each. The plots plot logA (X-axis) and log B(Yaxis)
where A and B are the intensities for alleles A and B respectively. Ellipses are
drawn for the genotype regions for Birdseed from the file generated from Birdseed giving
for each SNP, the means and the covariance matrix for A and B. The SNPs are
represented by numbers and the colors represent the genotypes(Blue=AA, Red=AB,
Green=BB)
Figure 11 (Click on Figure to see larger image)
Cluster plots for CRLMM (Left) and Birdseed (Right) plotted for 15 Genetics
of Kidneys in Diabetes (GoKinD) samples from Genetic Association Information
Network (GAIN) from Affymetrix for the Affy SNP 5.0 platform with plate id: 4RWG569
The plots plot logA (X-axis) and log B(Y-axis) where A and B are the intensities for
alleles A and B respectively. Ellipses are drawn for the genotype regions for Birdseed
from the file generated from Birdseed giving for each SNP, the means and the covariance
matrix for A and B. The SNPs are represented by numbers and the colors represent the
genotypes (Blue=AA, Red=AB, Green=BB)
Figure 12 (Click on Figure to see larger image)
Cluster plots for CRLMM (Left) and Birdseed (Right) plotted for 15 Genetics
of Kidneys in Diabetes (GoKinD) samples from Genetic Association Information
Network (GAIN) from Affymetrix for the Affy SNP 5.0 platform with plate id: 1LTX827
The plots plot logA (X-axis) and log B(Y-axis) where A and B are the intensities for
alleles A and B respectively. Ellipses are drawn for the genotype regions for Birdseed
from the file generated from Birdseed giving for each SNP, the means and the covariance
matrix for A and B. The SNPs are represented by numbers and the colors represent the
genotypes (Blue=AA, Red=AB, Green=BB)
Figure 13 (Click on Figure to see larger image)
Cluster plots for CRLMM (Left) and Birdseed (Right) plotted for 15 Genetics
of Kidneys in Diabetes (GoKinD) samples from Genetic Association Information
Network (GAIN) from Affymetrix for the Affy SNP 5.0 platform with plate id: 1CNF297
The plots plot logA (X-axis) and log B(Y-axis) where A and B are the intensities for
alleles A and B respectively. Ellipses are drawn for the genotype regions for Birdseed
from the file generated from Birdseed giving for each SNP, the means and the covariance
matrix for A and B: The SNPs are represented by numbers and the colors represent the
genotypes (Blue=AA, Red=AB, Green=BB)