Welcome
M vs S Plots
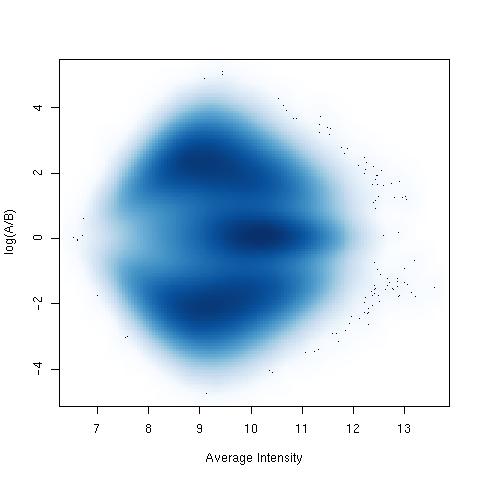
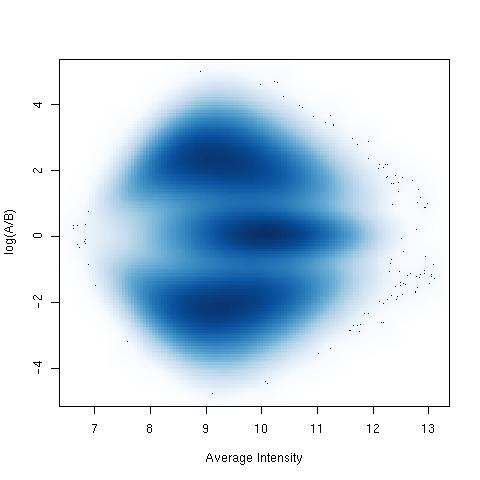
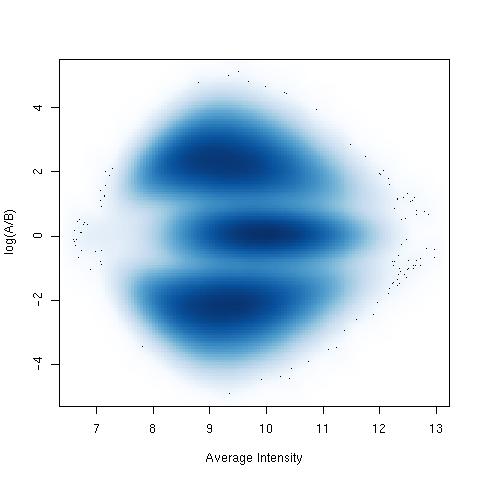
Figure 16 (Click on Figure to see larger image)
M vs S plots for array with the worst (left), mean (middle) and best (right)
SNR from the 54 samples of Genetic Association Information Network (GAIN) from
Affymetrix for the Affy SNP 6.0 platform. M=log(A/B) and Average Intensity (S) = [log(A)+log(B)]/2